Case study
A voting Tuesday drives like a regular one, until the polls close
We measured three national elections against the ordinary Tuesdays around them. The volume barely moves. The shape of the day moves every time.
Here is a prediction, published before the fact.
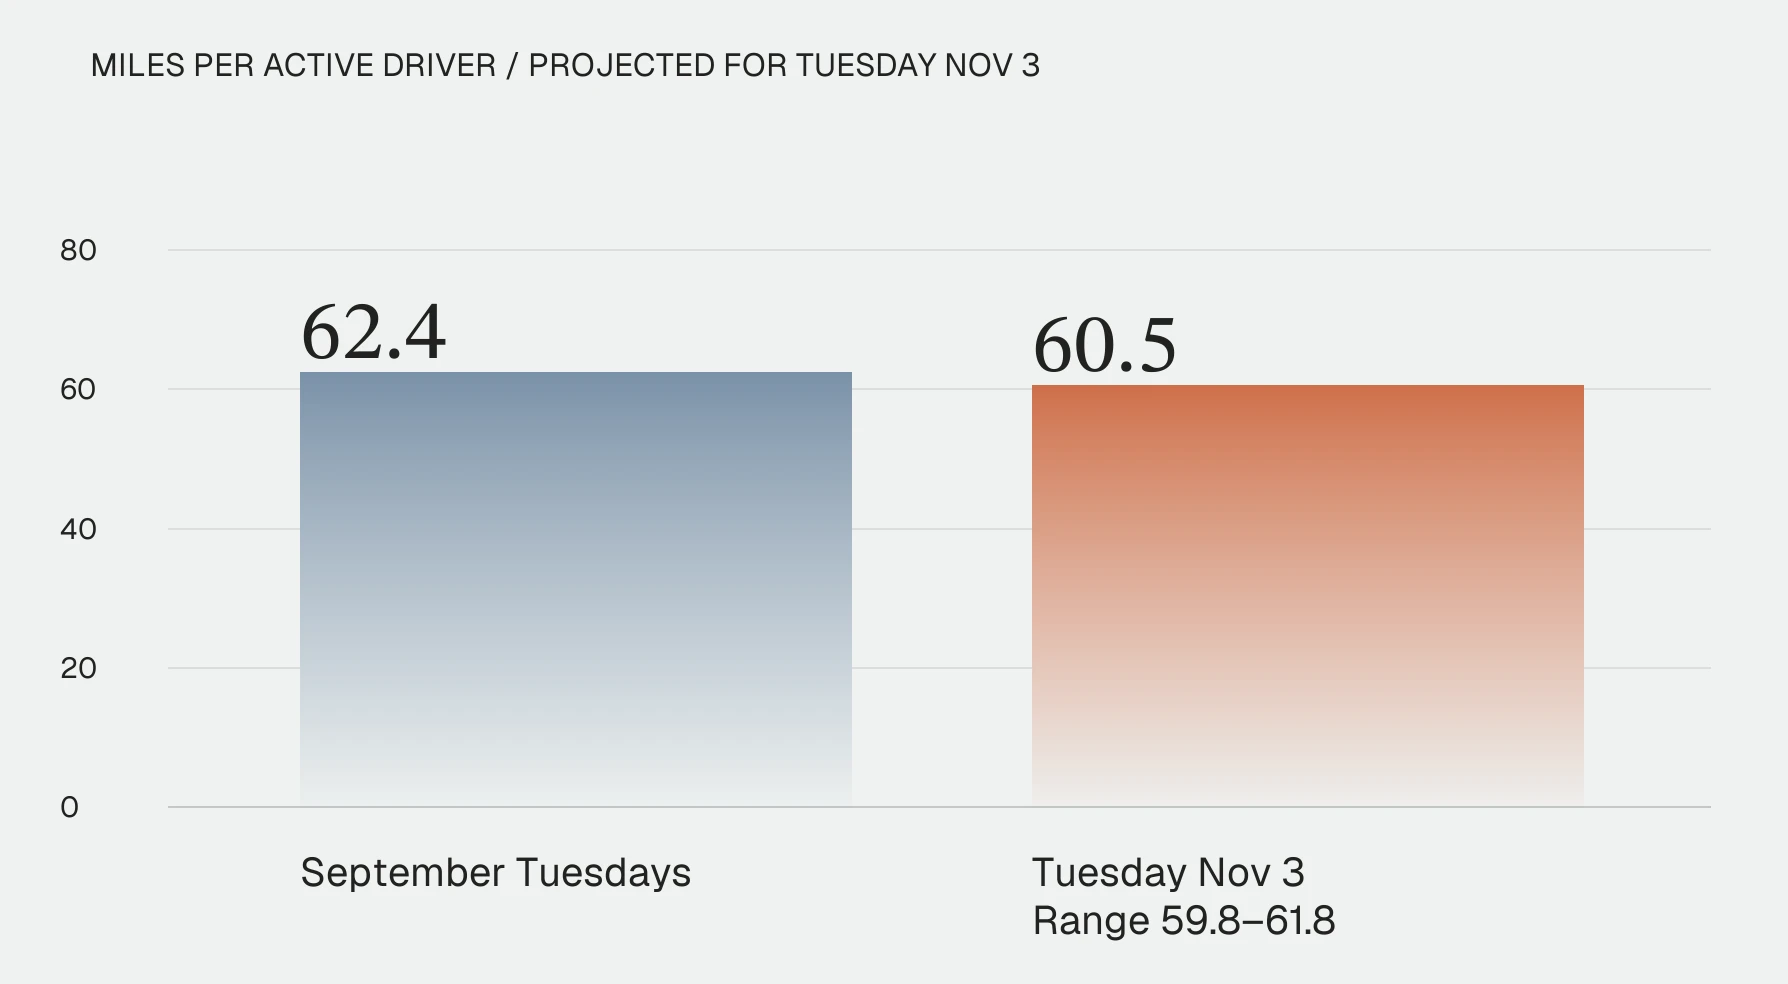
On Tuesday November 3, people who drive at all will cover about 60.5 miles each, against 62.4 on an ordinary September Tuesday. Call it a one to four percent dip, with our range running from 59.8 to 61.8 miles.
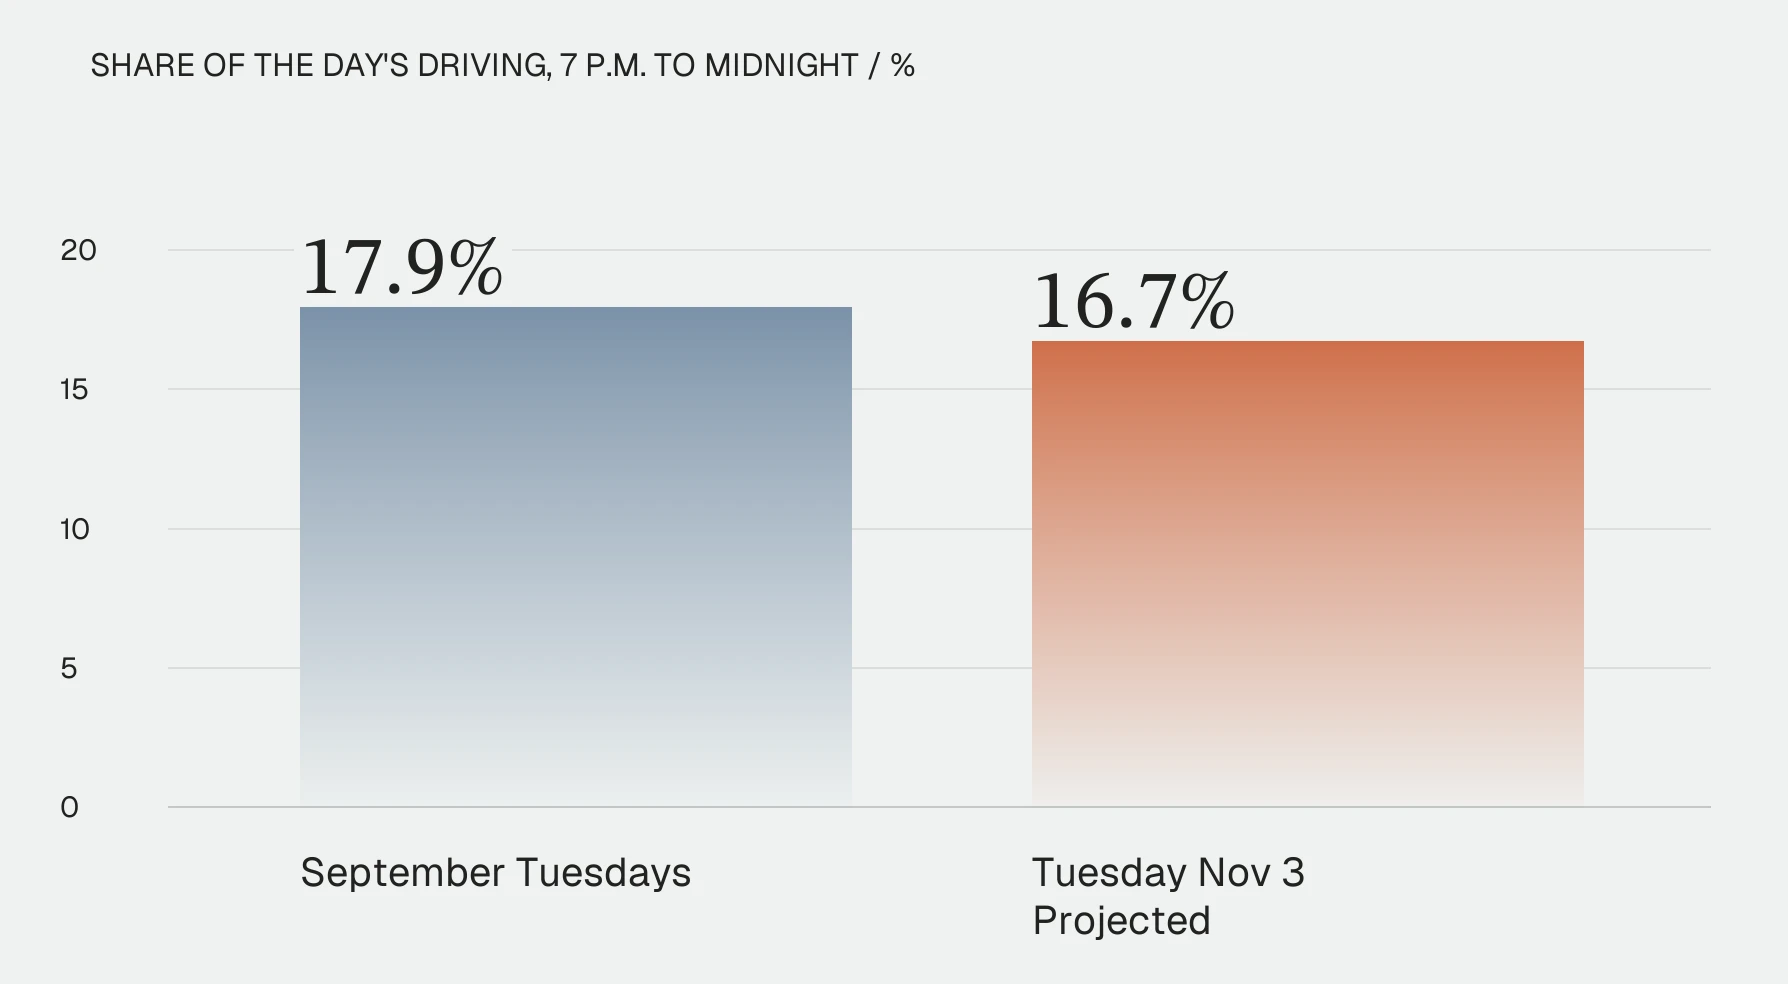
And about 16.7% of the day’s driving will happen between 7 p.m. and midnight, down from 17.9% on a normal Tuesday.
That second number is the one we’re confident about.
The evening is where Election Day stops looking normal
We took the last three national elections and compared each one against the other October and November Tuesdays of its own year. Then, to know whether any difference actually meant anything, we measured how much a perfectly ordinary Tuesday wanders from the Tuesdays around it, using 17 regular Tuesdays from years with no national election.
Most of what Election Day does falls inside that ordinary wandering. The evening doesn’t.
In all three elections, the share of the day’s driving between 7 p.m. and midnight fell further than any regular Tuesday managed. In 2022 it dropped by 0.87 percentage points. In the two presidential years it dropped by about two points, which puts those nights five to six standard deviations outside normal variation.
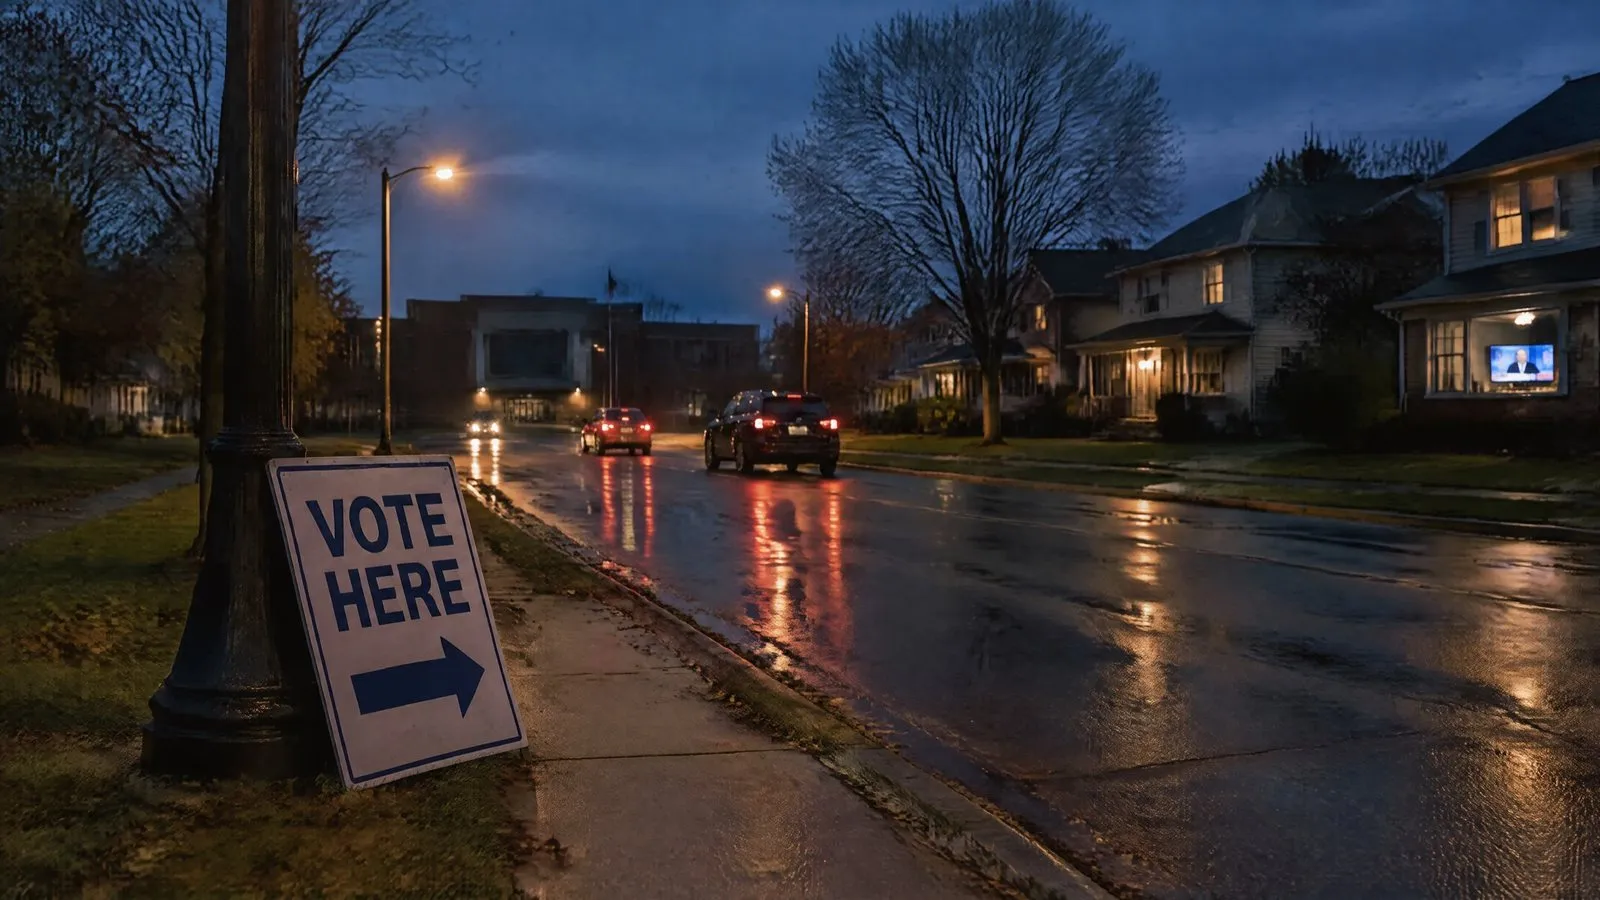
Polls close between 6 and 9 p.m. in most states, and the drop runs deepest in the years when the national result is most watched. People go home, and they stay there.
0.87
Percentage points, the 2022 evening drop
≈2
Points in the two presidential years
5–6
Standard deviations outside normal variation
Midday looks like a trip to the polls
The other consistent pattern runs through the middle of the day.
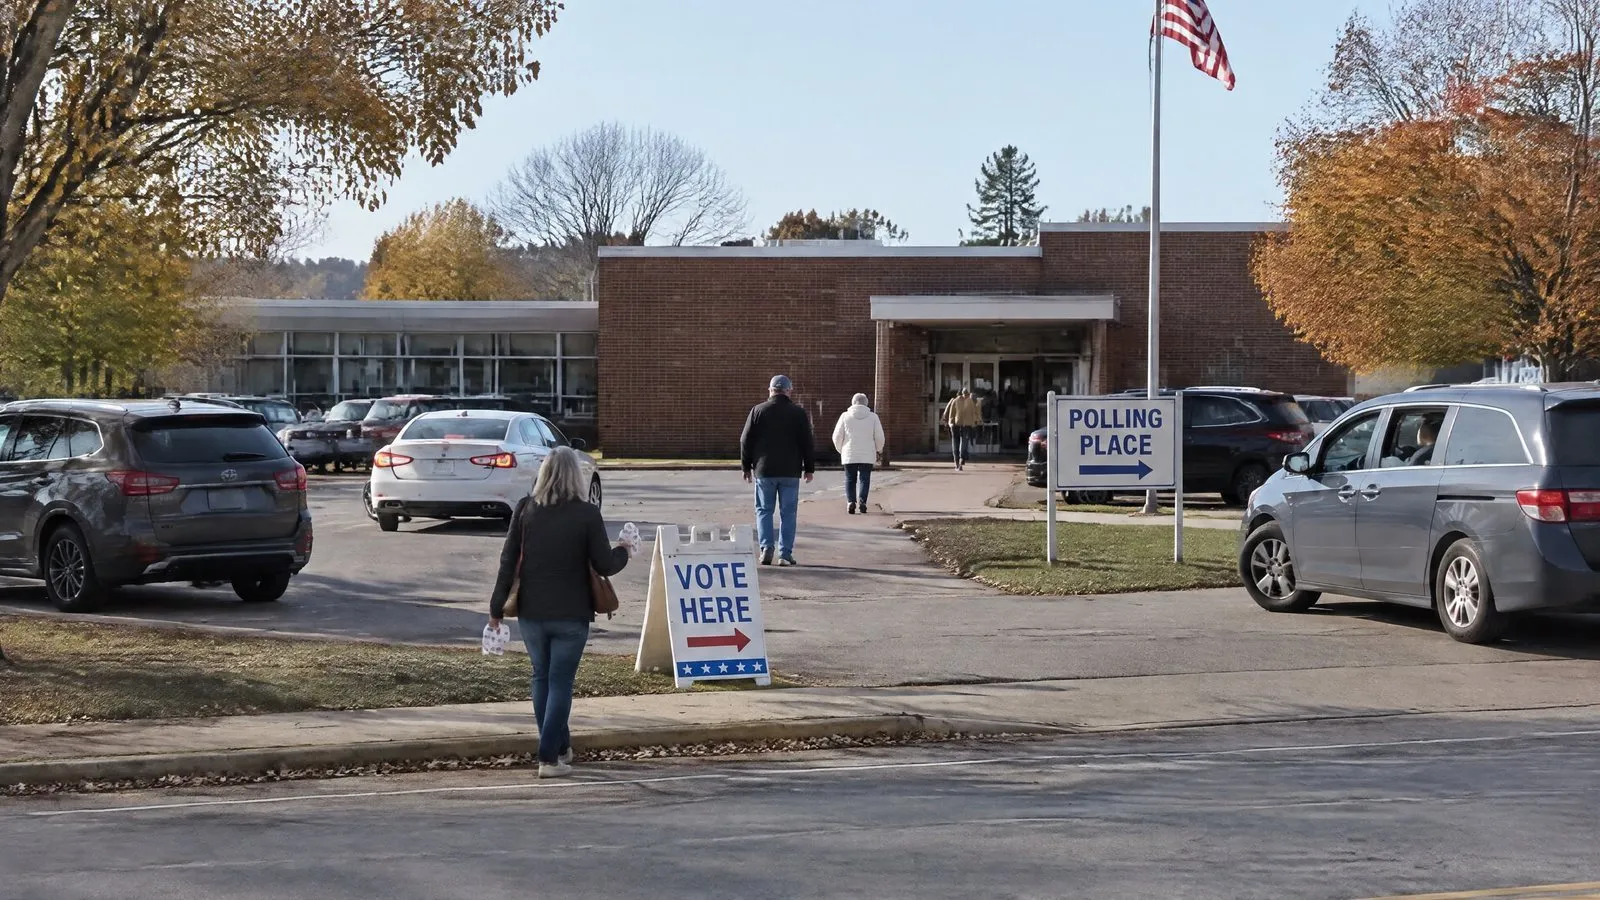
From 10 a.m. to 3 p.m., a slightly larger share of driving happens than on an ordinary Tuesday. The 1 p.m. hour clears normal variation in all three elections, the only hour of the day that does.
Alongside that, drivers took more trips and shorter ones. Trips per driver rose between 1.7 and 2.5 percent while miles per driver fell. More short errands, fewer long hauls. That is what a stop at a polling place looks like in traffic data, and it is also what happens when the afternoon school run moves or disappears, since many districts close and many schools are polling places.
10–3
10 a.m. to 3 p.m., a slightly larger share of driving than an ordinary Tuesday
1 p.m.
The only hour busier than an ordinary Tuesday in all three elections
1.7–2.5%
Rise in trips per driver, while miles per driver fell
More short errands, fewer long hauls.
What doesn’t change
Total driving. Miles per driver dipped in all three elections and never by more than an ordinary Tuesday can dip on its own. Election Day is not a quiet day by volume.
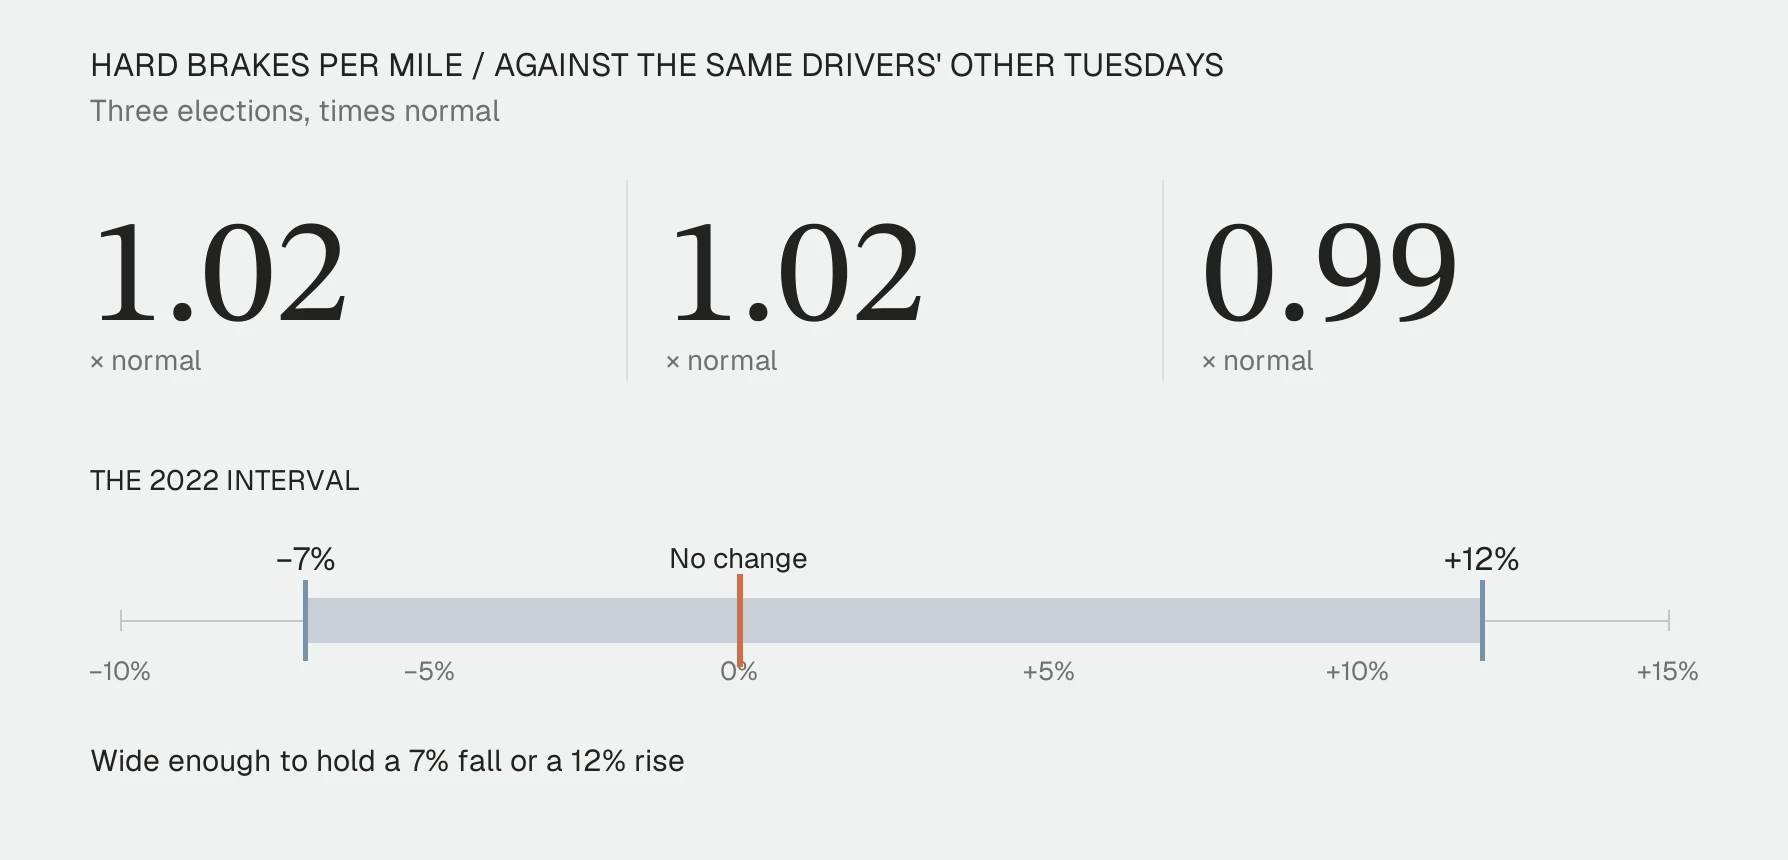
Hard braking. Comparing each driver against their own other Tuesdays, the rate came in at 1.02, 1.02 and 0.99 times normal, and every interval comfortably spans no change. We want to be precise about what that means: the 2022 interval is wide enough to hold a 7% fall or a 12% rise, so this is an absence of evidence at this precision rather than proof of no effect.
And roads near schools. With schools closed in many districts and used as polling places, we expected the share of hard braking near them to shift. It didn’t, in any of the three years. Whatever school-run traffic disappears appears to be replaced by voters using the same streets.
New York and Chicago, counted a different way
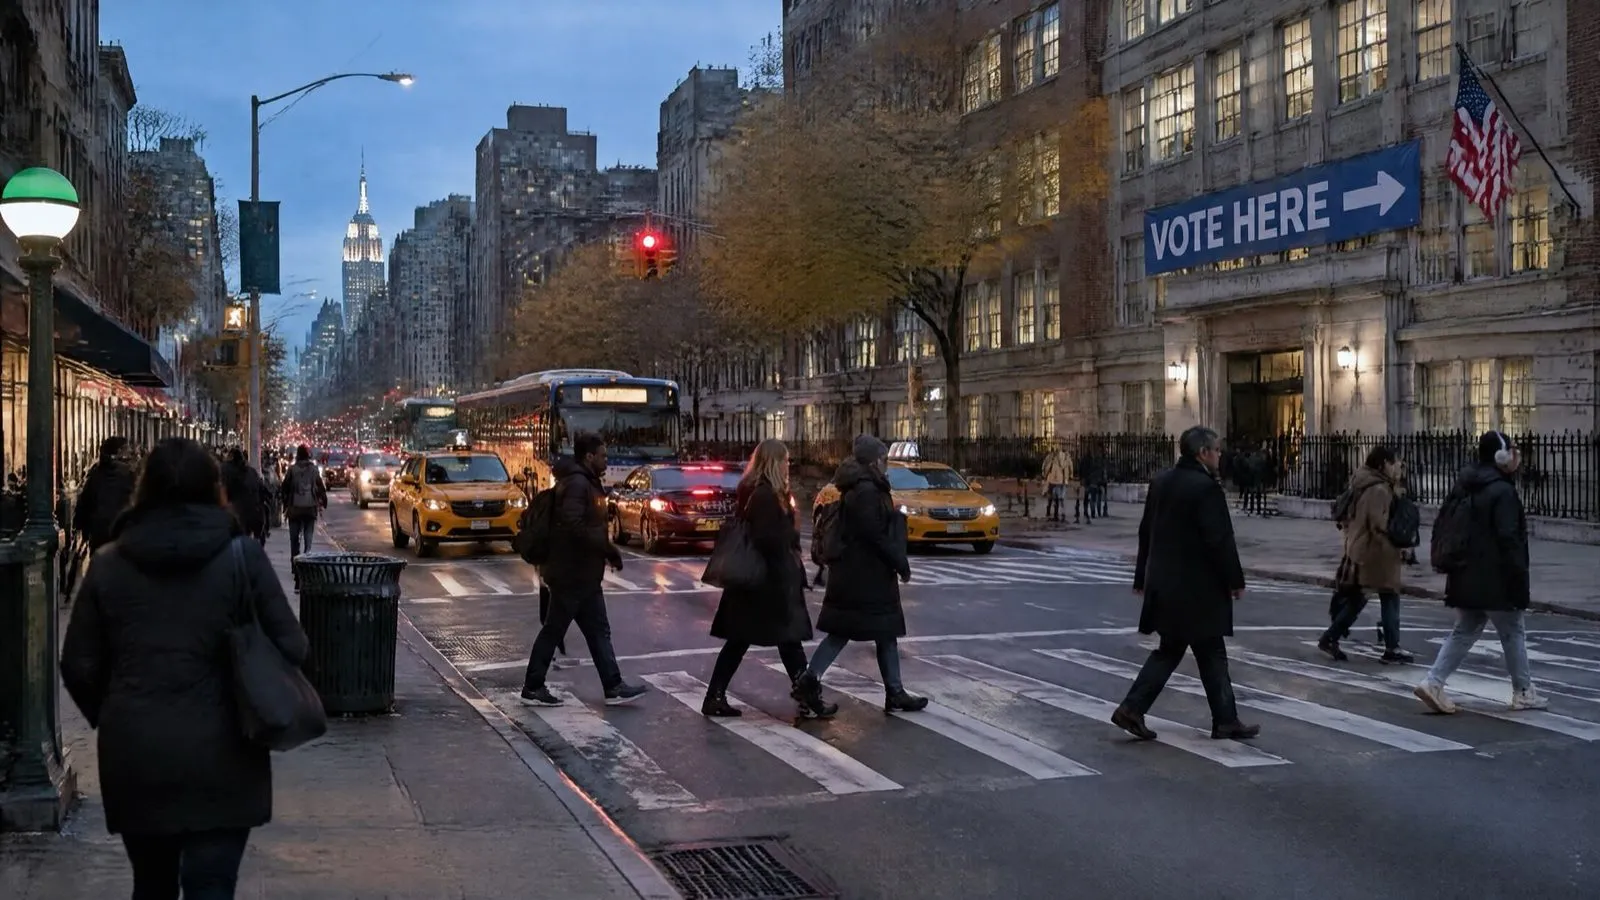
New York City and Chicago publish their police-reported crash records, so we read them for the same Tuesdays.
Three of the four city-years show fewer crashes on Election Day than on the comparison Tuesdays, by 14 to 18 percent. Chicago in 2024 shows no difference.
That sits comfortably with what we found, once you notice the two are counting different things. A crash count falls when fewer vehicles are on the road. Our rate is per mile, so less driving alone doesn’t move it. A count that drops 15 percent alongside a per-mile rate that holds steady is exactly what a modest drop in traffic, concentrated in the city and in the evening, would produce.
14–18%
Fewer police-reported crashes on Election Day, three of the four city-years. Chicago 2024: no difference.
What we’re putting on record
Our prediction for Tuesday rests on three elections, and only one of them was a midterm like this one. We’ve used that midterm for the headline number and the two presidential years for the range.
It is a projection from three data points, not a forecast. Weather, news and turnout are not in it, and nothing in a September baseline can see them.
We’re publishing it anyway, in advance, because a measurement company should be willing to be checked. We’ll measure Tuesday November 3 on the same fleet and publish how close we came, whether or not it flatters us.
What this can’t tell you
This is driving by the vehicles in our network, not a count of all traffic on American roads. It describes what our drivers did, which is a sample.
Hard brakes are a risk signal, not crashes. Collision events in the historical records can’t be placed to a day or a state, so there is no crash rate here.
Each trip is assigned to the state where it started and to that state’s main time zone, so trips that cross a state line, and the parts of a dozen states on a second time zone, land an hour off.
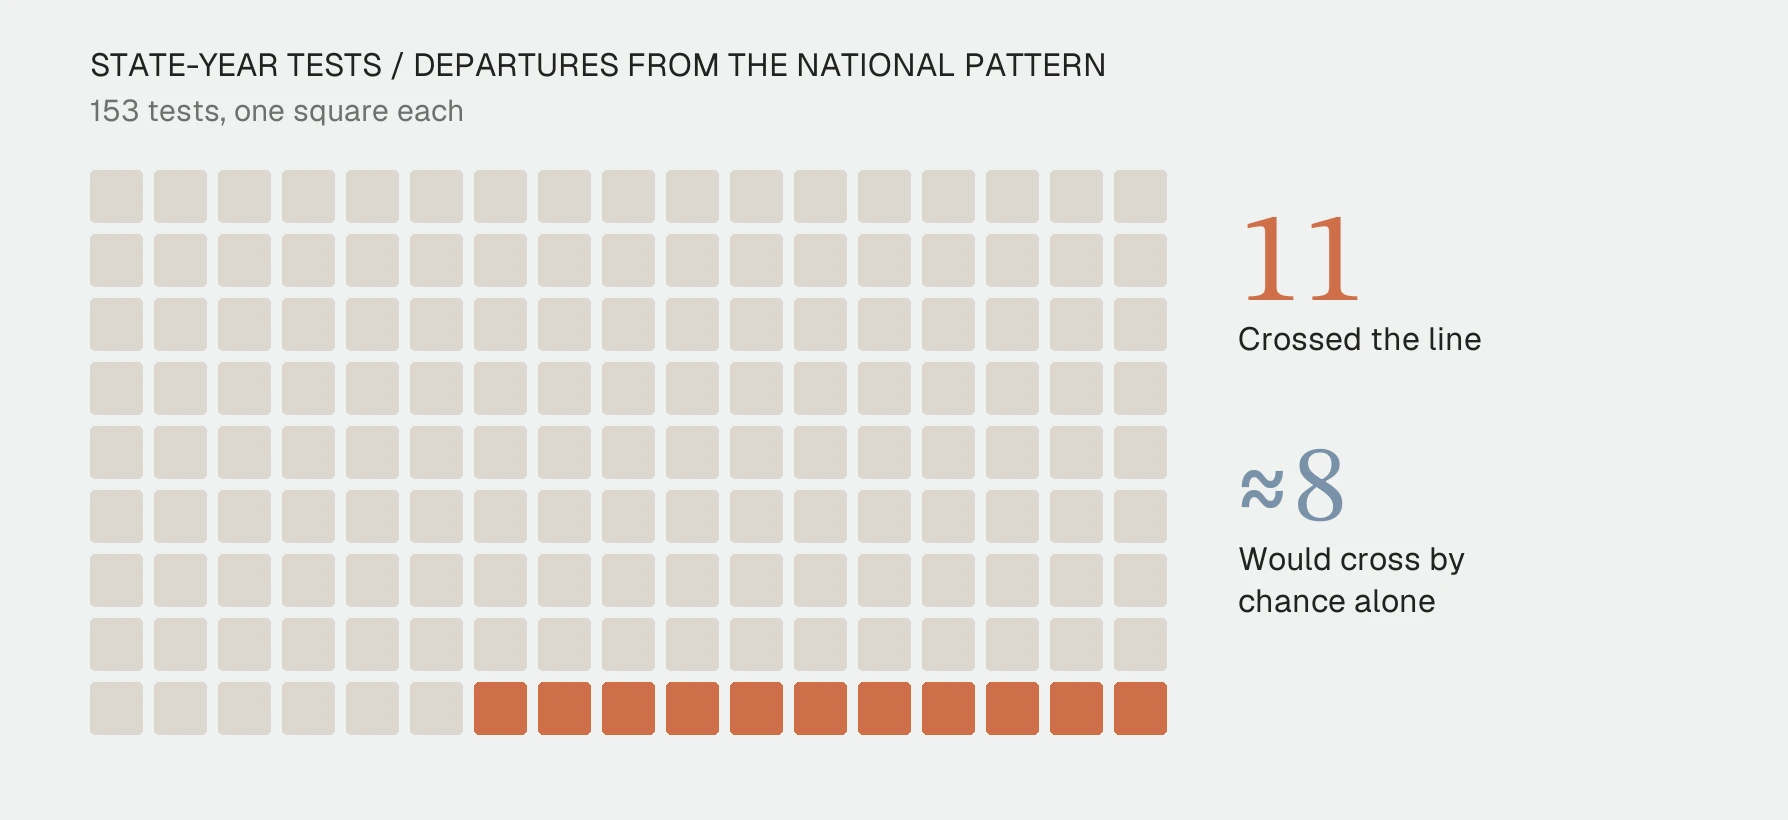
And this is a national picture. We looked for states that depart from it, and across 153 state-year tests, 11 crossed the line where about 8 would cross by chance alone. No state departs from the national pattern in more than one election.
The study in numbers
60.5 mi

Projected miles per active driver, Tuesday Nov 3
Range 59.8–61.8 · September Tuesdays: 62.4
16.7%

Projected share of the day’s driving, 7 p.m. to midnight
September Tuesdays: 17.9%
3 of 3

Elections where the evening drop went beyond normal Tuesday variation
1 p.m.

The only hour busier than an ordinary Tuesday in all three elections
1.02

Hard brakes per mile against the same drivers’ other Tuesdays
Not separable from normal
17

Regular Tuesdays used to establish what normal variation looks like