
Case study
Halloween doesn’t change how people drive. It changes when.
We compared six Halloween evenings against ordinary evenings in the same weeks of the same years. The braking barely moved. The traffic moved every single time.
Halloween has a reputation, and it’s earned. Published research on US fatality records found roughly 43% more pedestrian deaths on Halloween evening than on the same evening a week before or after. Most of that excess falls on children.
So we went looking for the driving behind it. If the roads are more dangerous that night, drivers should be braking harder and more often.
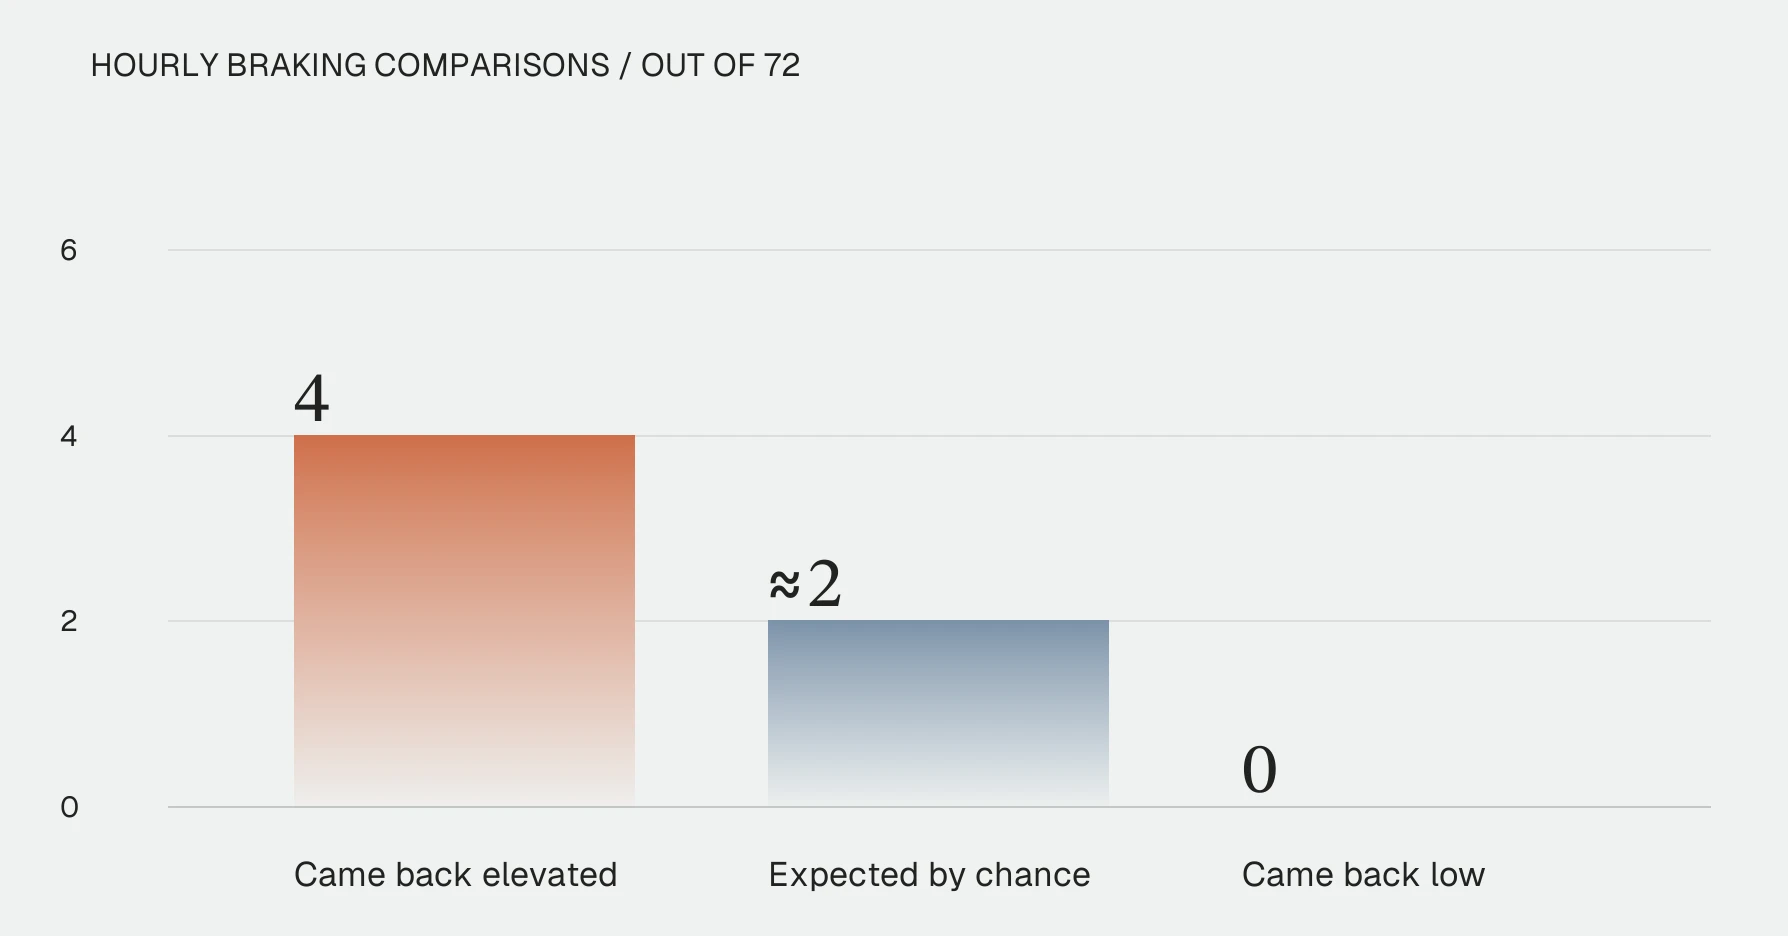
We took six Halloweens, 2020 through 2025, and compared each one against the same weekday on the three Tuesdays, or Fridays, or whatever Halloween happened to fall on, earlier that same month. Seventy-two hour-by-hour comparisons.
The braking barely moved
Four of those seventy-two hours came back elevated. You would expect about two to turn up elevated by chance alone in a test of that size, and none came back low.
No hour of the evening was elevated in more than one year. Not 6 p.m., not 8 p.m., not midnight. Across the full evening, the Halloween rate ran within a few percent of an ordinary evening in five of six years, and only one year separated from normal variation at all.
If you want a single sentence: on a per-mile basis, Halloween evening driving looks like Thursday evening driving.
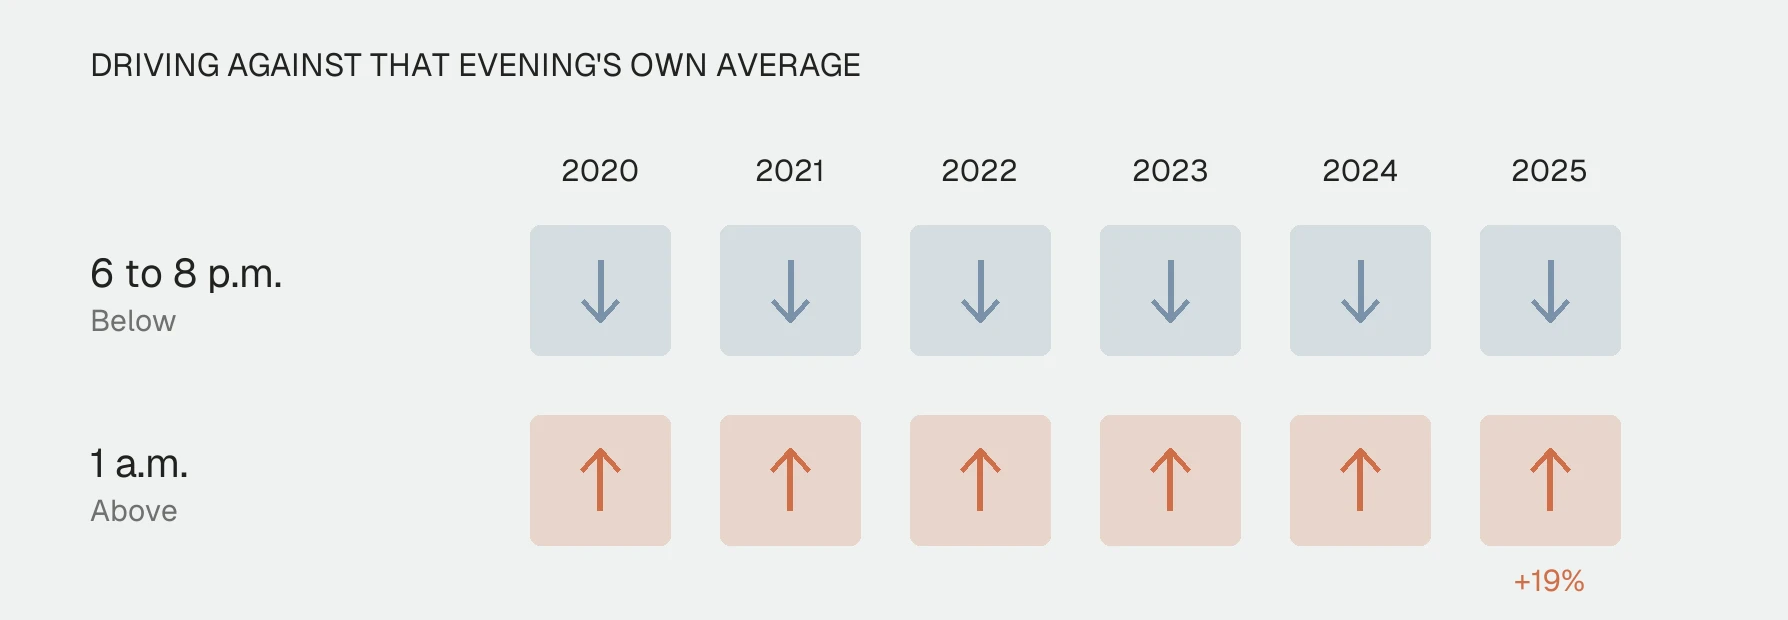
What moved every year was the traffic
Here the pattern is as clean as the braking pattern is absent.
In all six years, driving between 6 and 8 p.m. fell below that evening’s own average. In all six years, driving at 1 a.m. rose above it, by as much as 19% in 2025.
People get off the road while children are out, and then they drive late. Six years, no exceptions, both directions.
That’s the Halloween effect, and it’s a scheduling effect rather than a behavioral one.
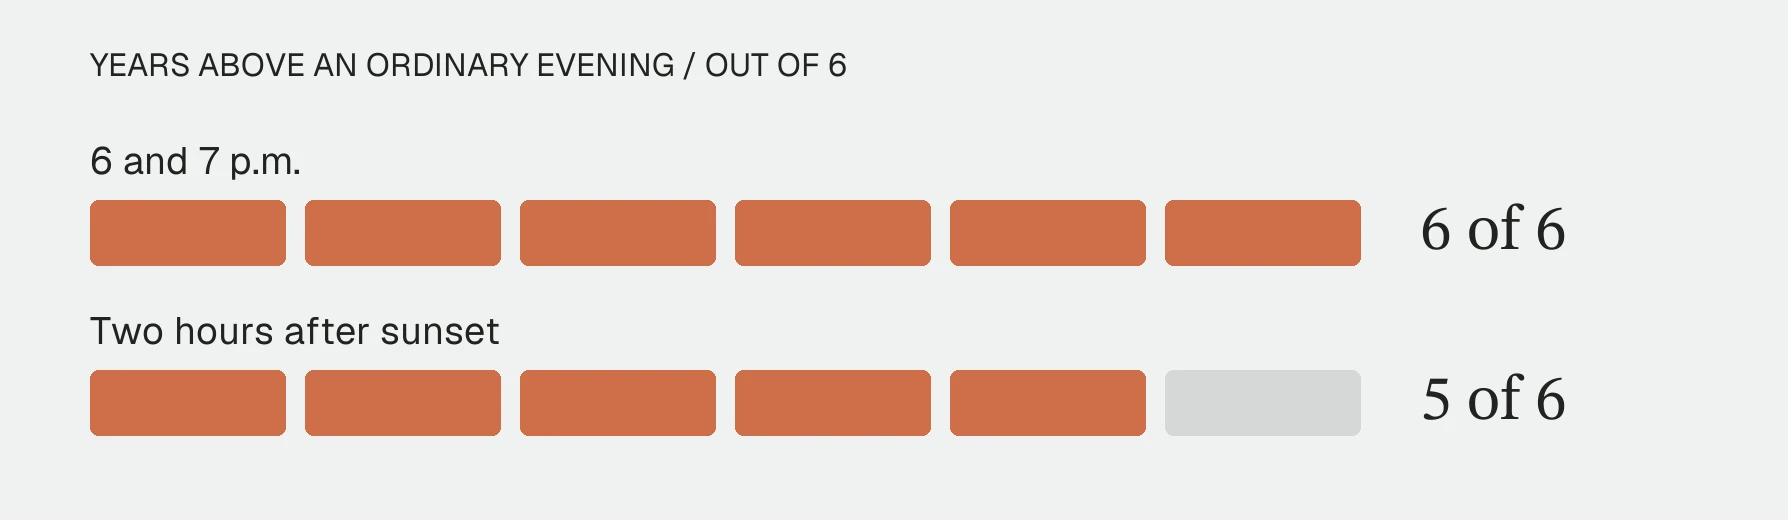
One window leans
There is a single stretch where braking tilts upward with any consistency. The hours of 6 and 7 p.m. came in above an ordinary evening in all six years, and the two hours after sunset came in above in five of six.
The direction is consistent. The size is small, between one and a few percent in most years, and no individual year separates from normal variation on its own.
It is worth naming as the window to watch, with that caveat attached. It’s also the window where published injury research puts the Halloween excess, so the timing agrees even though the measures don’t.
Both things are true
A reader who knows the 43% figure will want to know how it squares with a braking rate that doesn’t move. It squares like this.
A hard brake is a driver-side measurement, and it’s set mostly by ordinary traffic conditions, which on Halloween evening are lighter in exactly the trick-or-treat hours. Pedestrian deaths are driven by how many people are on foot and by alcohol.
The risk on Halloween evening is not that drivers drive worse. It’s that there are suddenly children between parked cars at dusk, in costumes, often dark ones, at the hour the light goes.
Nothing in our data contradicts the fatality record. The two measures agree on timing and they’re counting different things.
What we can say about this Saturday
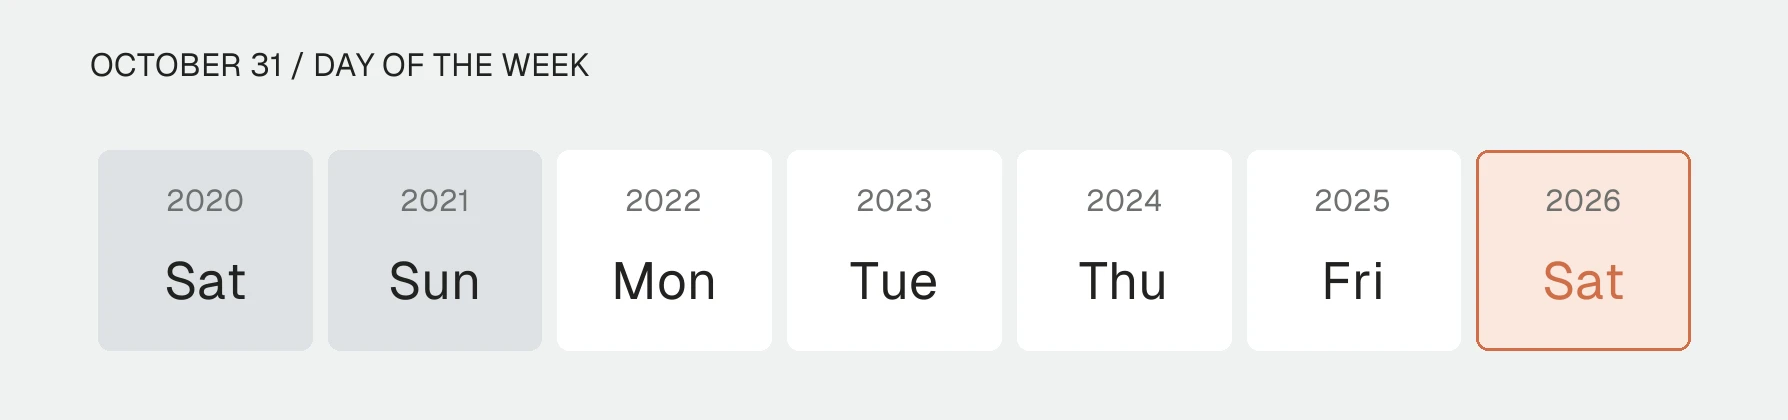
Halloween 2026 falls on a Saturday, and we have less to go on than we’d like.
Our six years contain exactly one Saturday Halloween, 2020, when driving and gatherings were suppressed and the clocks changed overnight. The next closest is 2021, a Sunday.
What those two weekend years suggest, and it’s a suggestion rather than a finding, is that the slightly elevated stretch runs later on a weekend. It held above an ordinary evening at 8 p.m. in both weekend years and fell below at 8 p.m. in every weekday year.
The two most recent weekday Halloweens, a Thursday and a Friday, put their only measurable excess after midnight.
A Saturday may carry both: a longer early evening and a late-night tail. We’ll know more after this one.
Where the braking happened
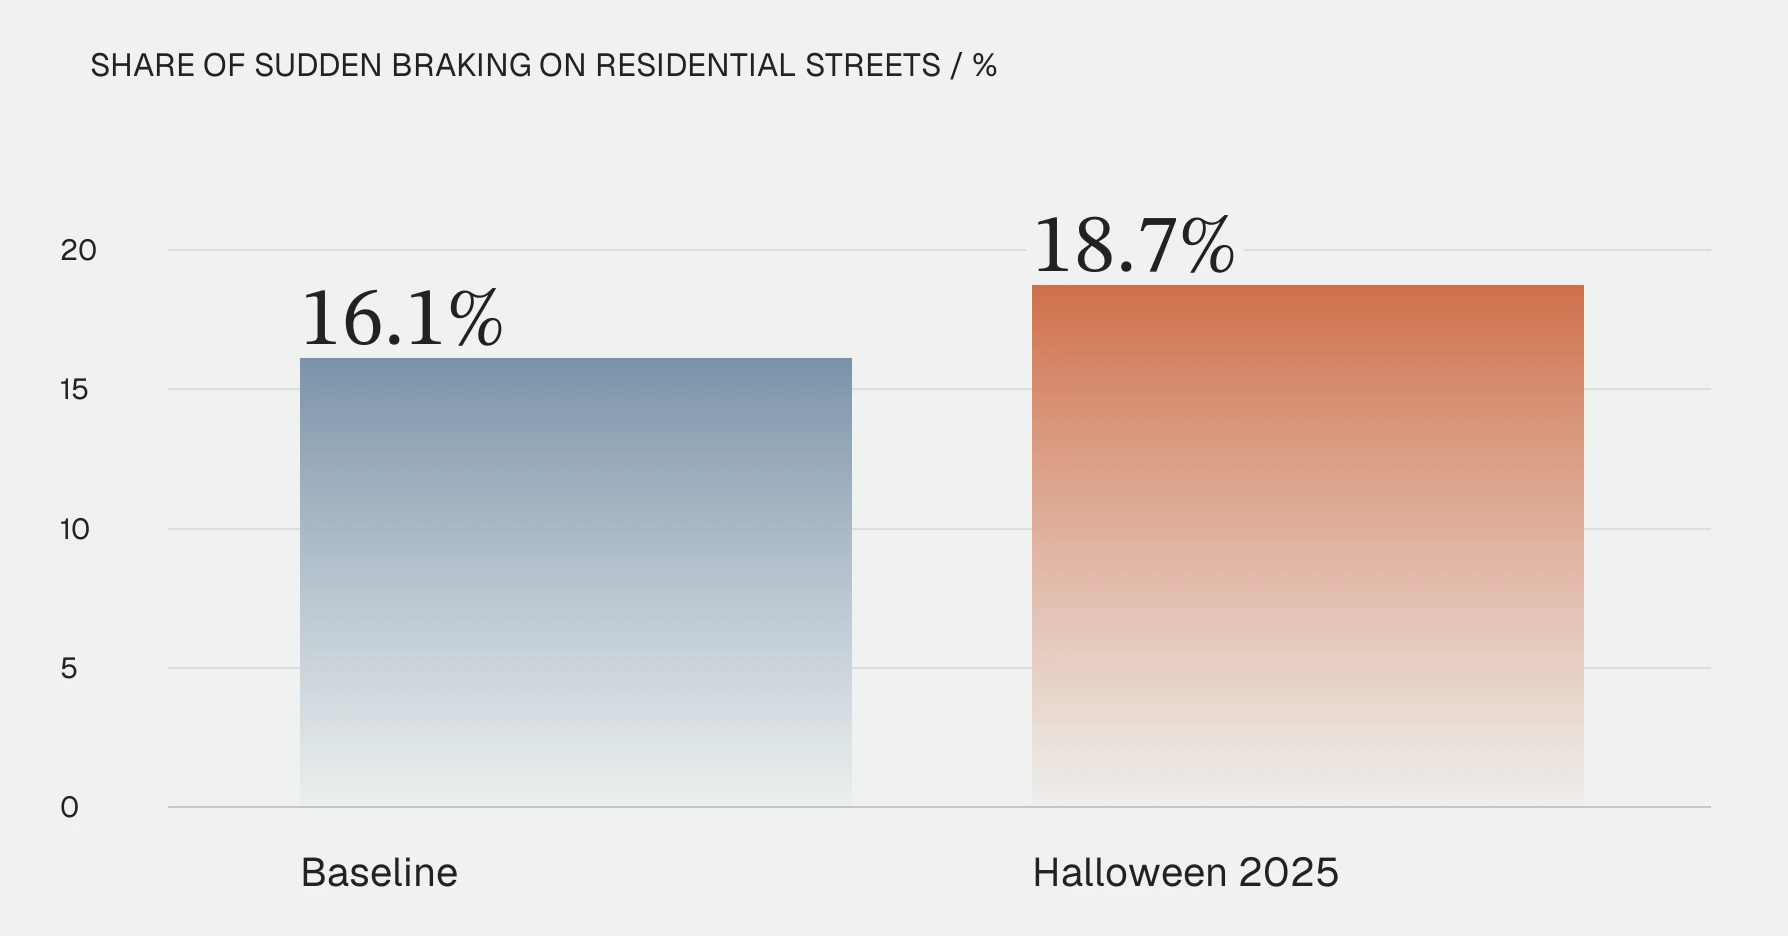
In 2025, the share of sudden braking that occurred on residential streets rose from 16.1% to 18.7%, while the share on motorways fell. Roads near schools showed no difference.
That’s a share, not a rate. It tells you where the braking moved, not that residential streets became more dangerous per mile. It fits the traffic picture: Halloween evening driving is more local.
What this cannot tell you
We cannot see whether any sudden stop involved a pedestrian, let alone a child in a costume. No one is identified in this data. A hard brake is a sudden-stop situation, and congestion produces them too.
We can only compare each Halloween to its own year. The fleet and the detection changed between 2020 and 2025, so there is no trend here and we’re not claiming one.
And the weekend reading rests on two years, one of them 2020. We’ve said what it points at. We haven’t called it a finding.
The study in numbers
6 of 6

Years with lighter driving between 6 and 8 p.m. than that evening’s own average
6 of 6

Years with heavier driving at 1 a.m.
4 of 72
Hourly braking comparisons that stood out, against about two expected by chance
1 of 6

Years where the whole evening separated from an ordinary evening
+2.6 pts
Share of sudden braking on residential streets, Halloween 2025 vs baseline
6

Halloweens measured, 2020 through 2025