Case study
Sudden stops cluster where people walk
We counted every hard brake across 21.3 million hours of American driving over a year. They don’t fall where most people assume.
Ask someone when a driver is most likely to slam on the brakes and you’ll usually hear some version of “when they’re tired.” Late in a long drive. Late at night. Far from home.
We counted 760,696 of them across 21.3 million hours of driving over twelve months. The pattern is almost the opposite.
The first ten minutes
Sudden braking is at its highest in the first ten minutes of a trip, and it falls steadily from there. Over the first ten minutes the fleet records roughly one hard brake every 20 hours of driving. After two hours on the road, one every 48.
Past the first hour, the rate runs at about half what it was in the first half hour.
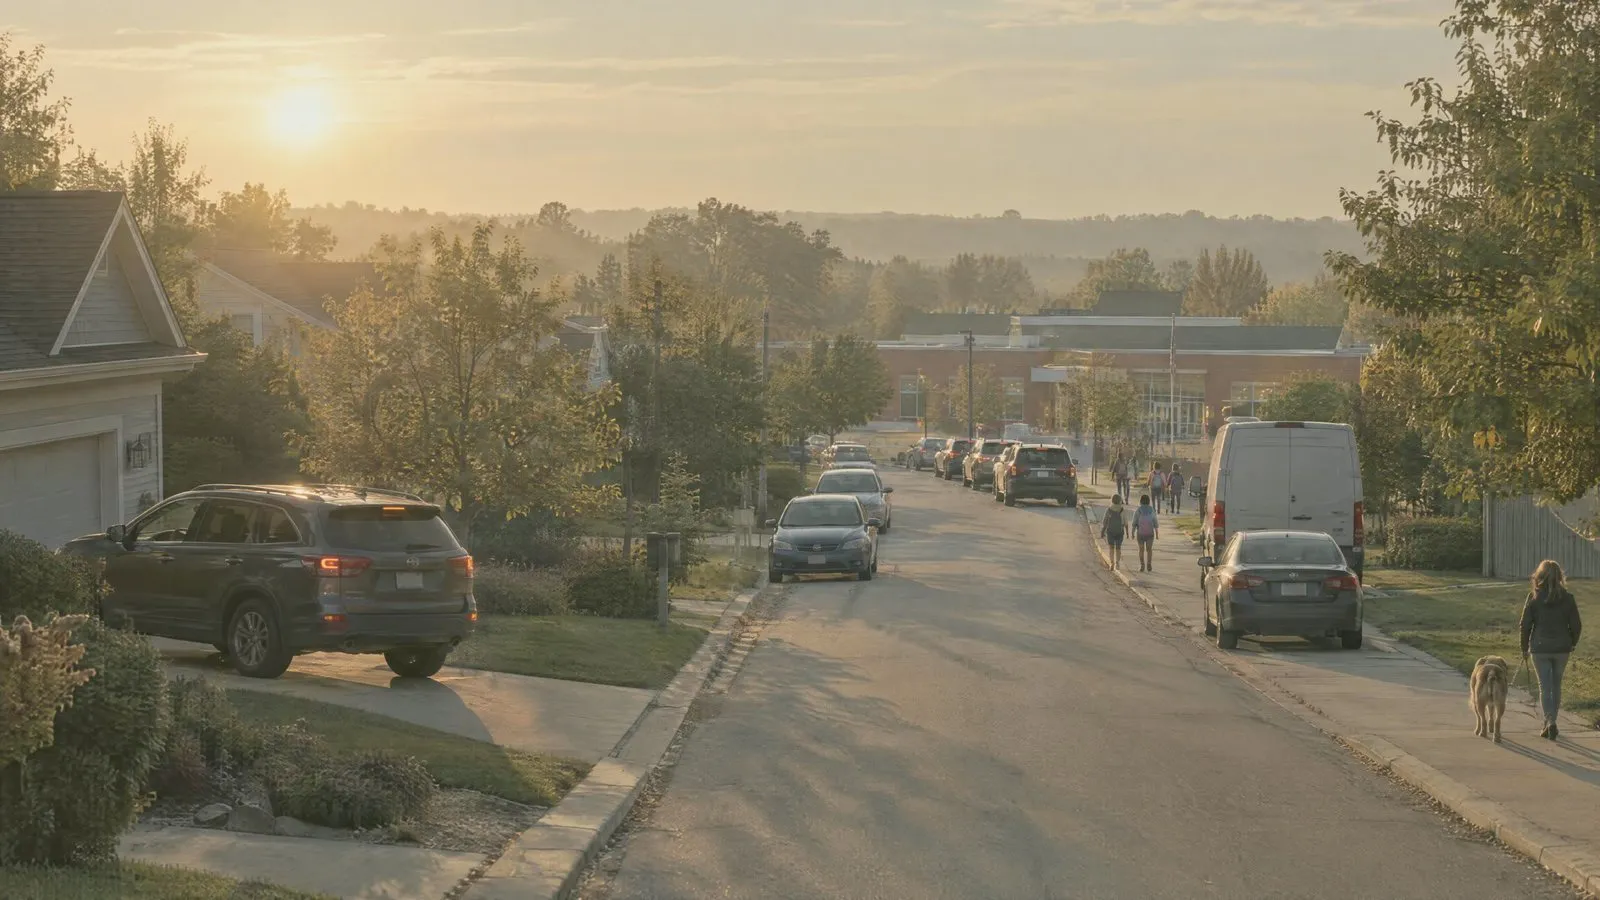
That first stretch is the part nobody thinks about. It’s the driveway, the parking lot, the school pickup line, the three blocks of neighborhood street before you reach anything with a center line. It’s the most familiar driving a person does, and it’s where the most sudden reactions happen.
It’s also where the people are.

Five in the afternoon
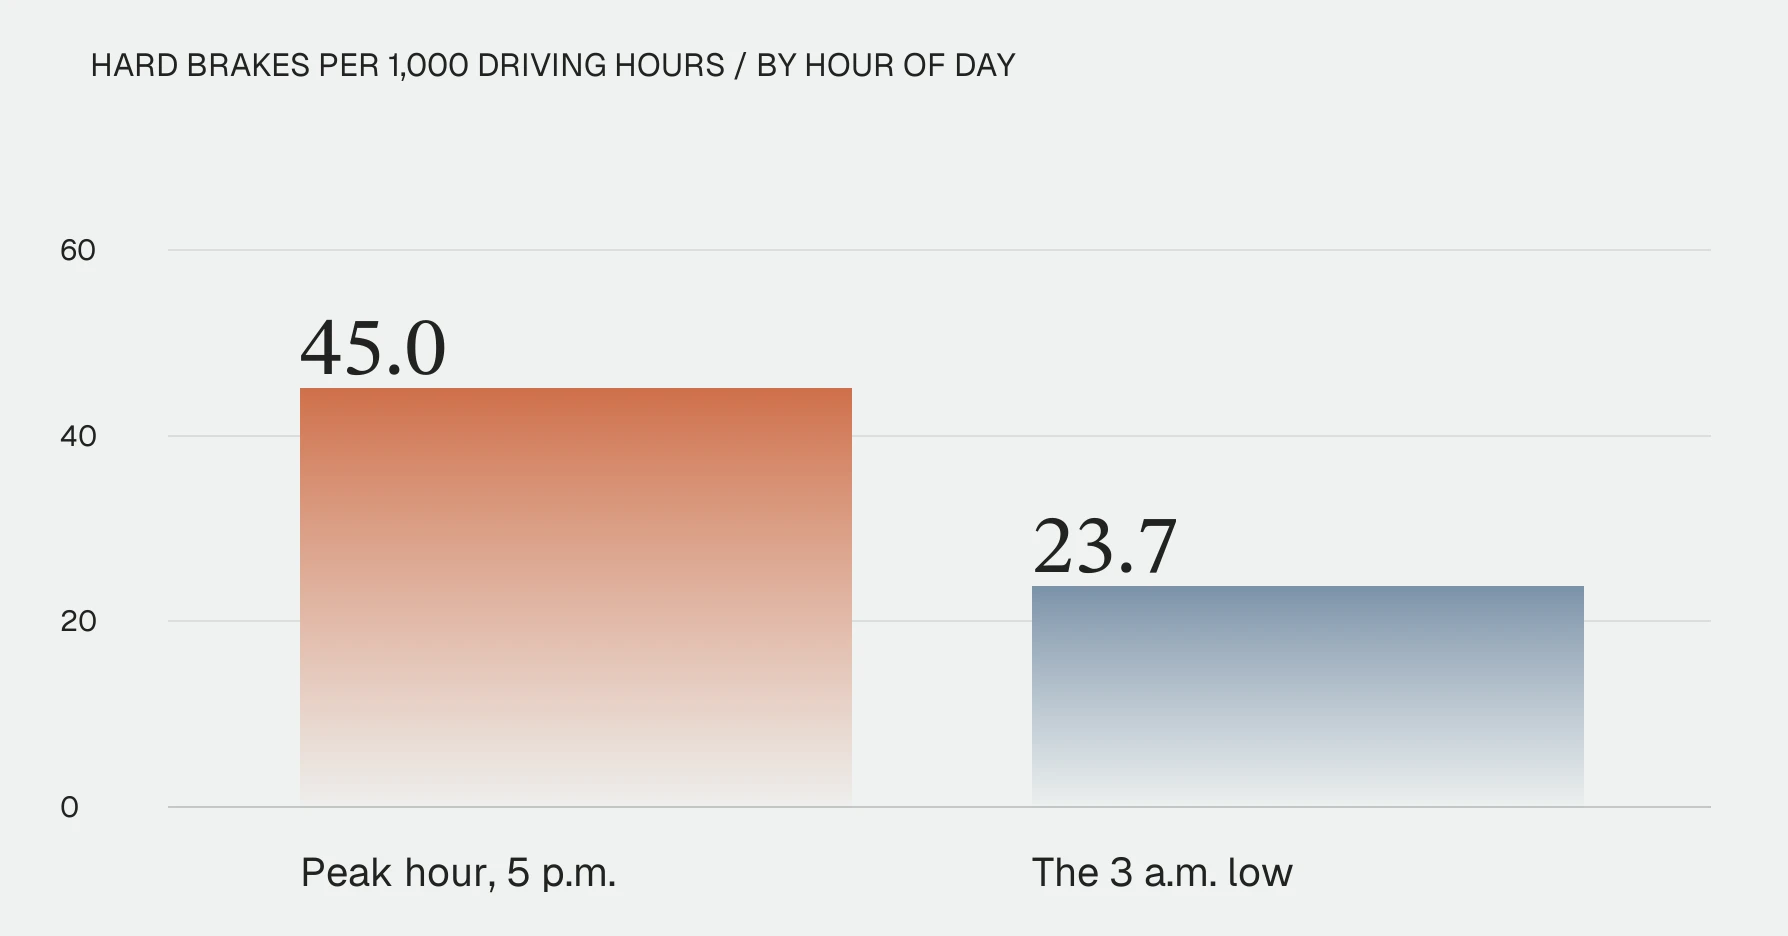
Across the day, hard braking climbs through the afternoon and peaks at 5 p.m., at about one hard brake every 22 hours of driving. The quietest hour is 3 a.m., at one every 42.
From October through March, that 5 p.m. peak sits at or after sunset across most of the country. The hour with the most sudden stops is also, for half the year, the hour the light goes.
Local streets, by a factor of ten
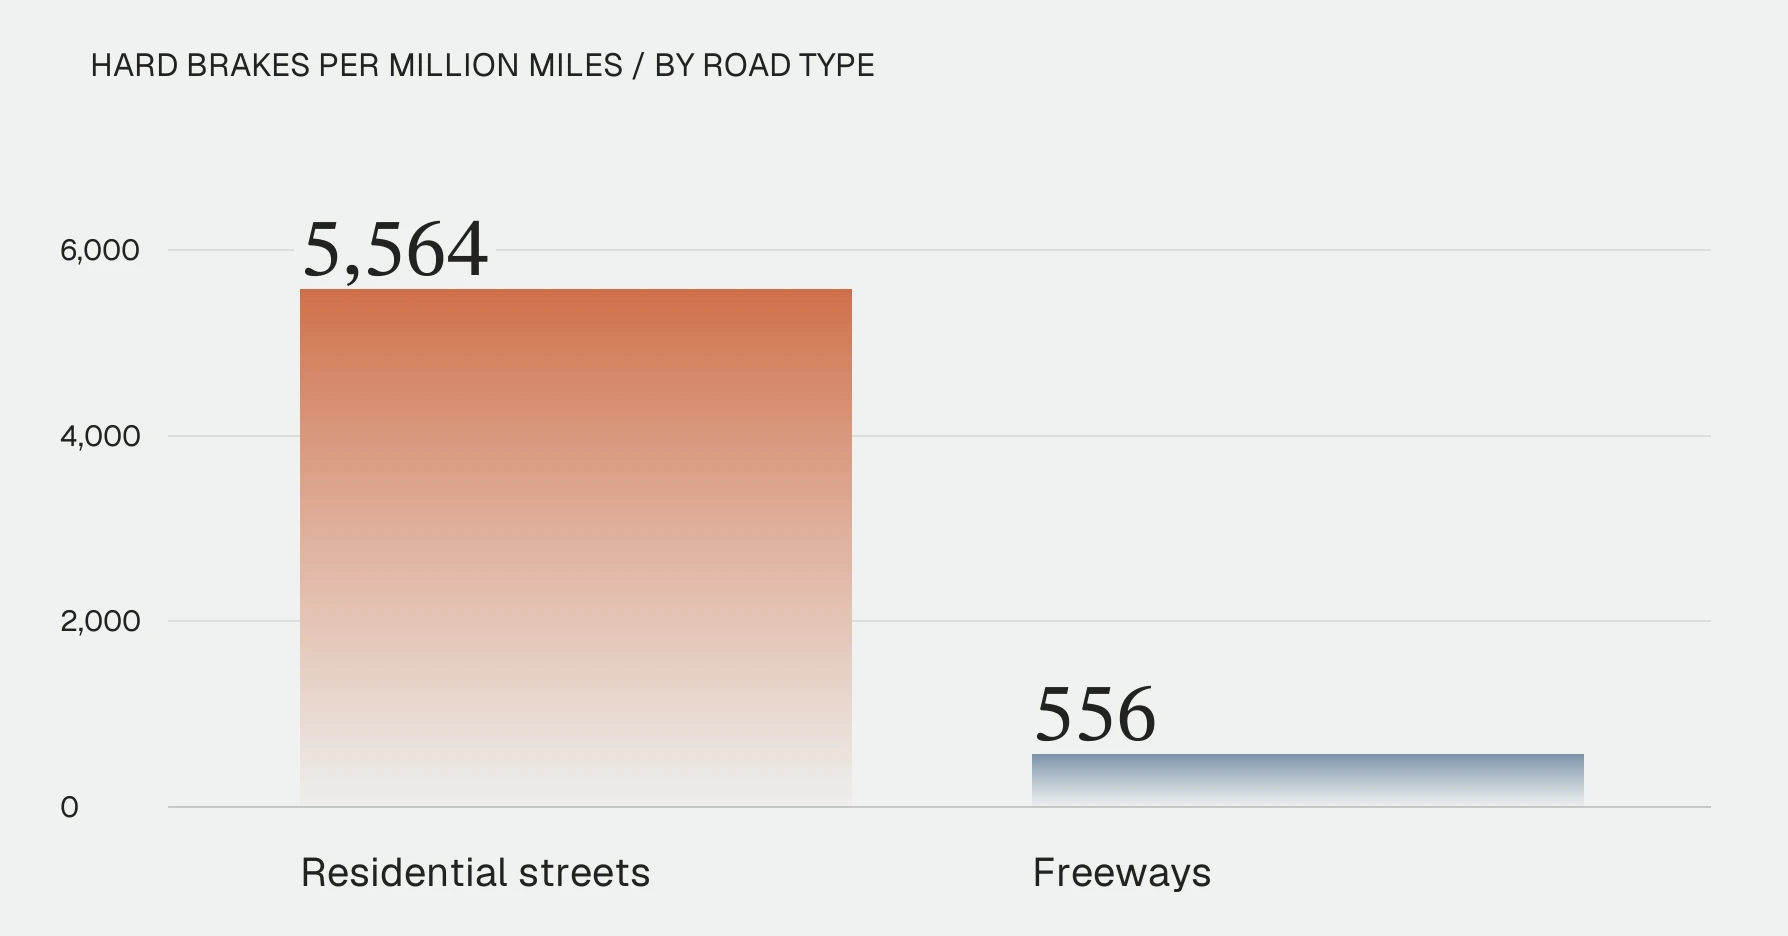
Mile for mile, drivers brake suddenly about ten times as often on residential streets as on freeways. Service roads and parking areas come next, then collectors and arterials. Freeways are the quietest road in the network by a wide margin.
Which makes sense. A freeway mile has almost nothing to brake for. A residential mile has driveways, parked cars, kids, dogs, delivery vans and someone backing out without looking.
Dense cities, two ways
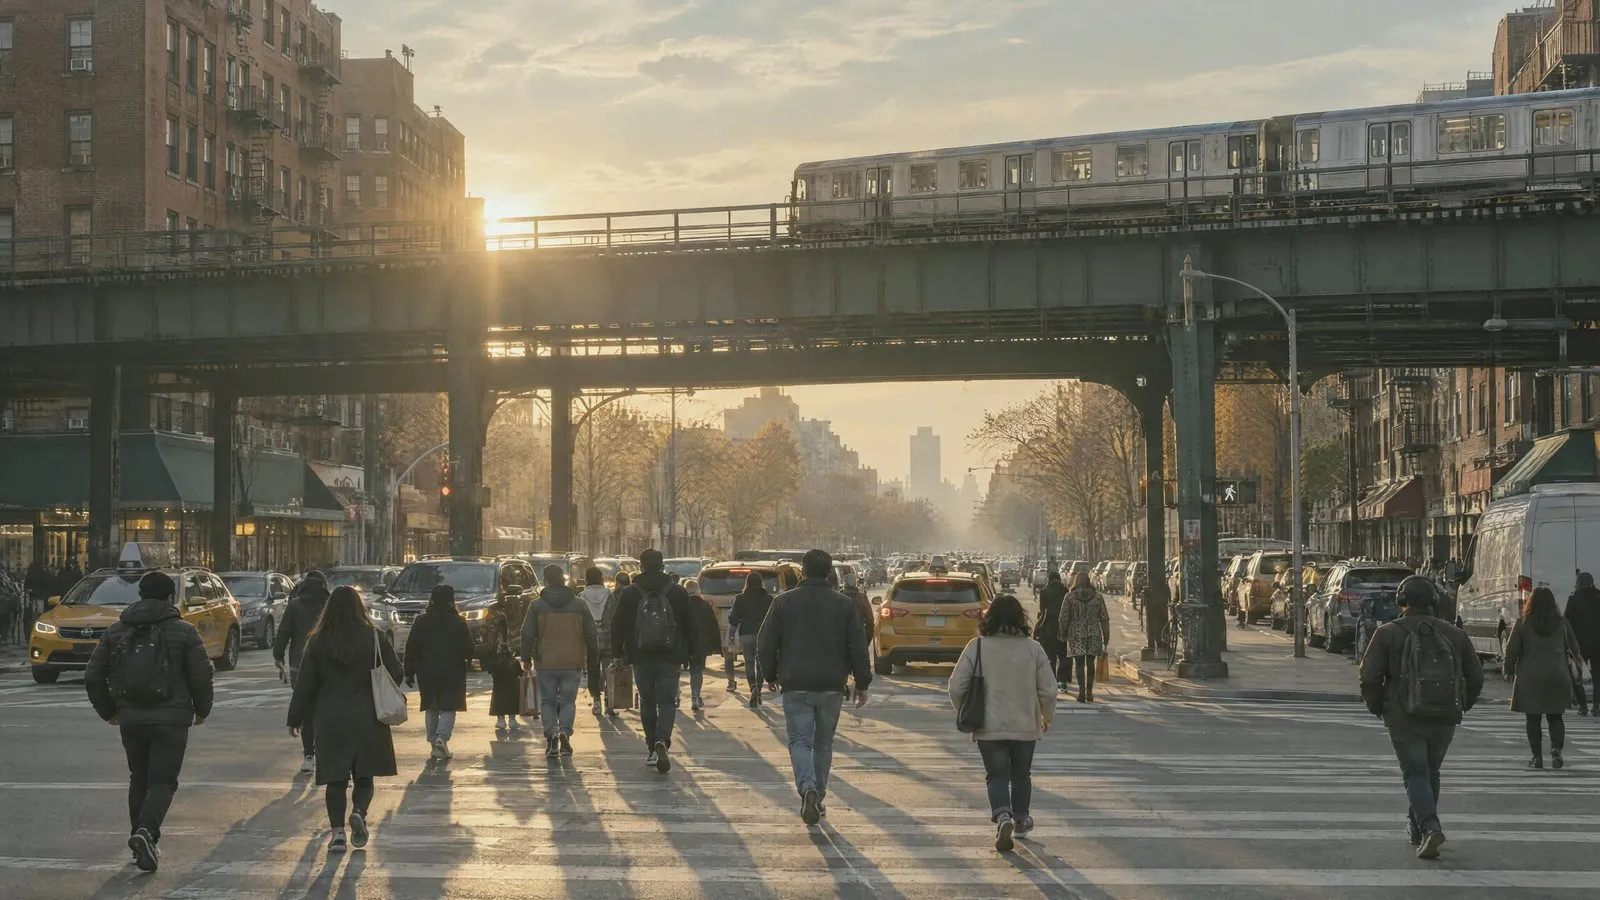
Per mile driven, the heaviest sudden braking in the country is in dense metros. Los Angeles runs about twice the national rate. So do Queens, Brooklyn and the Bronx. San Francisco runs higher still.
That’s raw exposure, and it’s what you’d expect. A mile in Queens holds more intersections, more crossings, more parked cars and more people than a mile almost anywhere else in America.
Ask a different question and you get a different answer. Measured against what their own mix of trips predicts rather than against the national average, several of those same places come in low. Across a full year, Manhattan, the Bronx and Cook County all brake less than their traffic would lead you to expect.
Both things are true at once. City driving produces the most sudden stops per mile in the country, and city drivers handle that environment better than the environment alone would predict. The first fact is about the road. The second is about the driving.
The night result, and why it isn’t reassuring
Here is the finding that needs care.
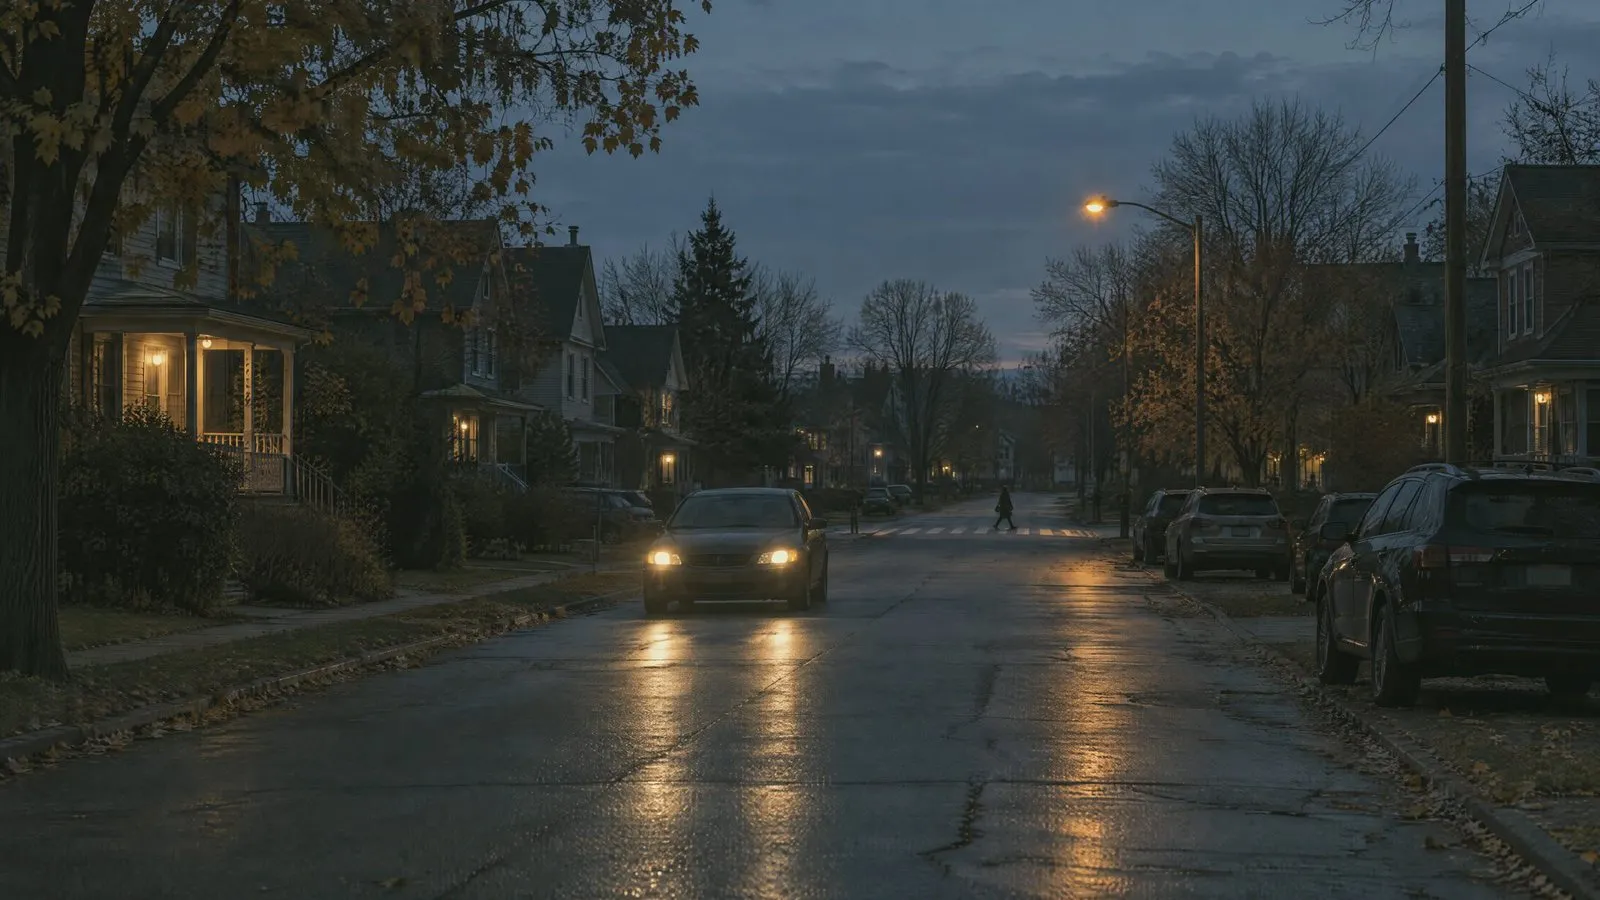
Per hour of driving, hard braking between 9 p.m. and 5 a.m. runs about 12% below the daytime rate. Fewer sudden stops at night.
That is not the same as safer. National figures put most pedestrian deaths in the dark. The two measures count different things. A fatality is a conflict the driver did not resolve. A hard brake is a conflict the driver saw in time to react to.
Fewer hard stops at night, alongside more deaths at night, fits a picture where drivers are seeing people too late to brake at all. Our data cannot prove that. It can say that the reassuring reading, that night driving produces fewer emergencies and is therefore calmer, does not follow from these numbers.
The practical version for a driver is simple. At night, slow down, and don’t assume you’ll see someone in time.
What this measures, and what it doesn’t
A hard brake is the camera’s sudden-deceleration trigger, roughly half a g or more. It records that a driver reacted hard. It cannot tell us what they reacted to. Nobody in this dataset is identified as a pedestrian, and we are not counting crashes or injuries.
Every rate here is per hour or per mile of driving, so a busy hour doesn’t count as riskier just because more people are out in it.
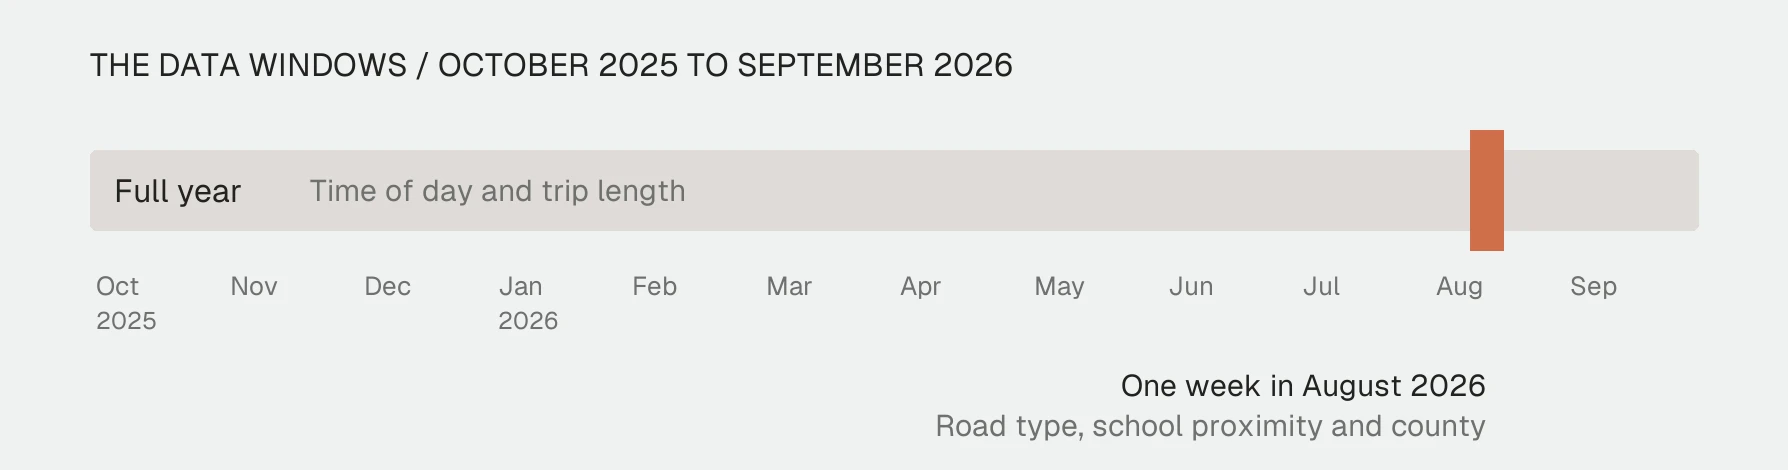
Road type, school proximity and county figures come from a single week in August 2026. The time-of-day and trip-length findings come from the full year.
One thing we tried to measure and couldn’t: braking near crossings and bus stops. The road reference data we use has no crossing or bus-stop counts at all, so there is no number to publish and we’re not going to publish a stand-in and call it one. Rebuilding that is on the list.
What to do with it
Take the first ten minutes slowest. It’s the stretch closest to home, closest to schools, and the one drivers treat as already over before it’s begun.
Treat 3 to 6 p.m. as the window where sudden stops and people on foot overlap most, and in winter, as the window where that happens in the dark.
For anyone running a fleet, pedestrian-awareness coaching belongs at trip start and depot exit, not in general safety briefings. The risk is front-loaded into the first ten minutes and the data is unambiguous about it.
The study in numbers
49.2

Hard brakes per 1,000 driving hours, first ten minutes of a trip
About one every 20 hours
20.8

Same measure, after two hours on the road
About one every 48 hours
45.0

Peak hour, 5 p.m.
Against 23.7 at the 3 a.m. low
10×
Residential streets vs freeways, per mile
5,564 vs 556 per million miles
760,696
Hard brakes measured
21.3M

Hours of driving, October 2025 to September 2026