
We ranked 26,830 vehicles over a year of driving, then checked whether the safe ones stayed safe. They did.
Start with the gap, because it’s larger than anyone expects.
We sorted 26,830 vehicles by how often they braked hard over twelve months, then set that ranking aside and watched what the same vehicles did for the next six. The safest group recorded one hard brake every 3,300 miles. The least safe group recorded one every 109 miles.
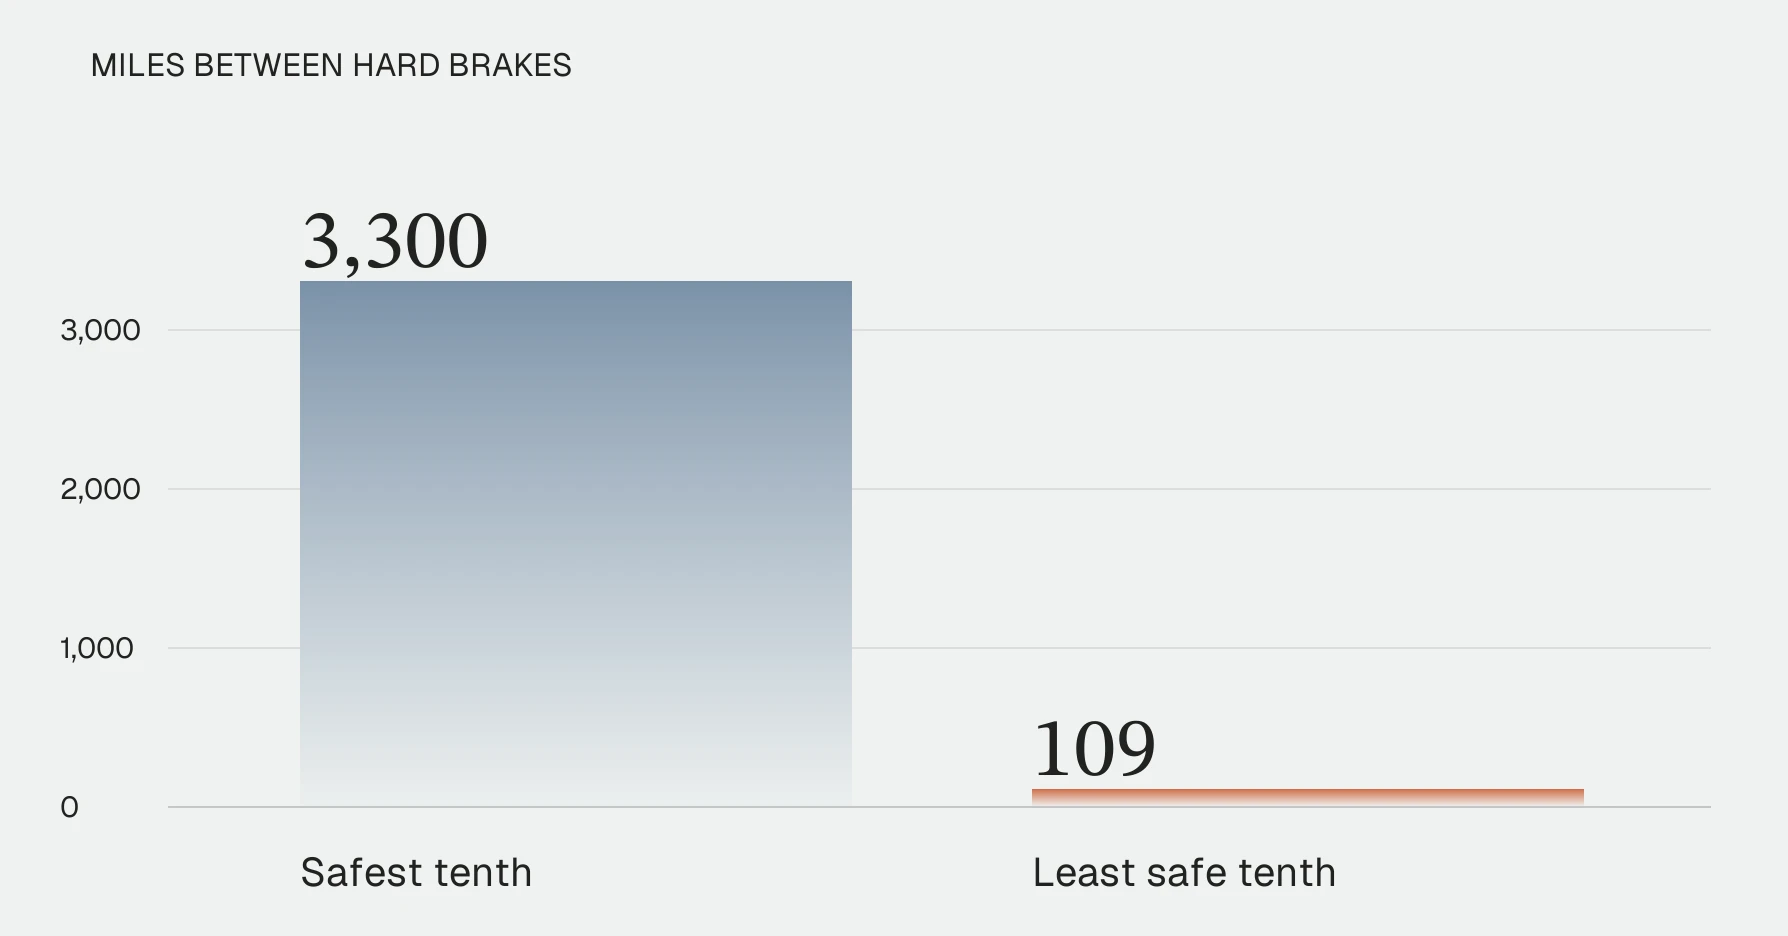
Common zero-based scale: 0–3,500 miles. A longer bar means more miles between events.
Those are two sets of vehicles driving the same kinds of roads, the same share of highway and city miles, in the same mix of vehicle types. The difference is not where they drove. It’s how.
423M
Miles measured across 26,830 vehicles.
The obvious answer was wrong.
The first time we ran the ranking, the safest vehicles were long-haul trucks on highways.
That’s a real result and a useless one. Highway miles produce almost no hard braking, because there is nothing to brake for. Dense city streets produce fifteen times more per mile. Rank anyone on raw braking and you will rediscover the interstate.
So we accounted for it. Every trip in the study was sorted by length, by average speed, by time of day, and by vehicle type, and each vehicle was measured against what its own particular mix of trips should produce. A vehicle that drives nothing but Manhattan at rush hour is held to a Manhattan-at-rush-hour standard.
After that adjustment, the safest and least safe groups look identical on paper. Same share of highway miles, 13.9% against 13.6%. Same share of city miles, 54.3% against 54.3%. Same proportion of trucks. Whatever separates them, it isn’t the road.
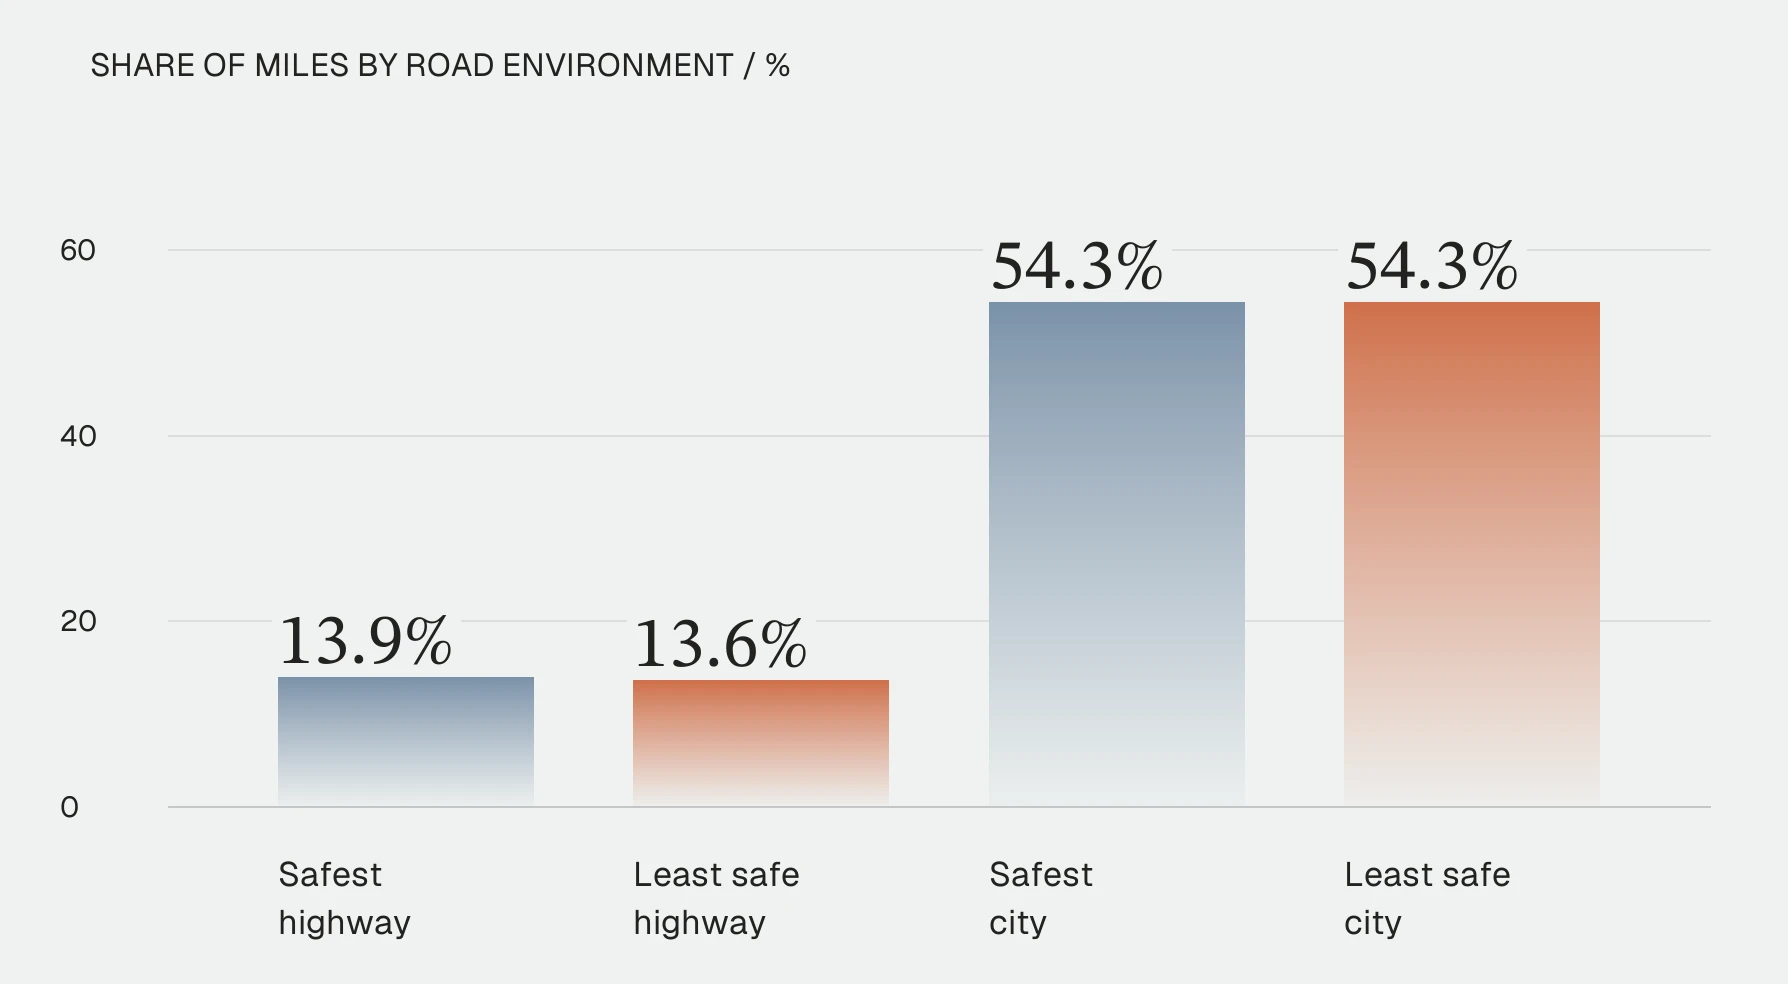
What the safest vehicles have in common.
Four things, and none of them require a special route.
They drive more. The safest group covered 23,851 miles in the year. The least safe covered 12,761. That’s 87% more driving, and it points the opposite way from the usual assumption that more exposure means more risk. The people out there the most are the smoothest.
+87%
More miles driven by the safest group. 23,851 vs 12,761 in the year.
They take longer trips. Trips averaged 28 miles against 18, and the safest group drew less of its mileage from short hops under five miles. Every short trip is a start, a stop, a merge and a park. Fewer of those, fewer chances to stand on the pedal.
They drive less at night. The safest group spent 3.2 fewer percentage points of its mileage in the hours between 8 PM and 6 AM, and more of it in daylight and at peak times. That holds even after the model accounts for the hour, which means it isn’t just that night driving is different. It’s that these vehicles do less of it.
They’re steadier. More midday miles, more peak-hour miles, fewer late shifts. The profile is of regular, daytime, long-route work rather than scattered evening runs.

It holds up six months later.
Any ranking finds a best tenth. The question is whether it means anything the following week.
Of the vehicles that ranked safest in the first six months, 82% were still in the top three tenths in the second six, on data the ranking had never seen. At the other end, 93% of the least safe stayed in the bottom three.
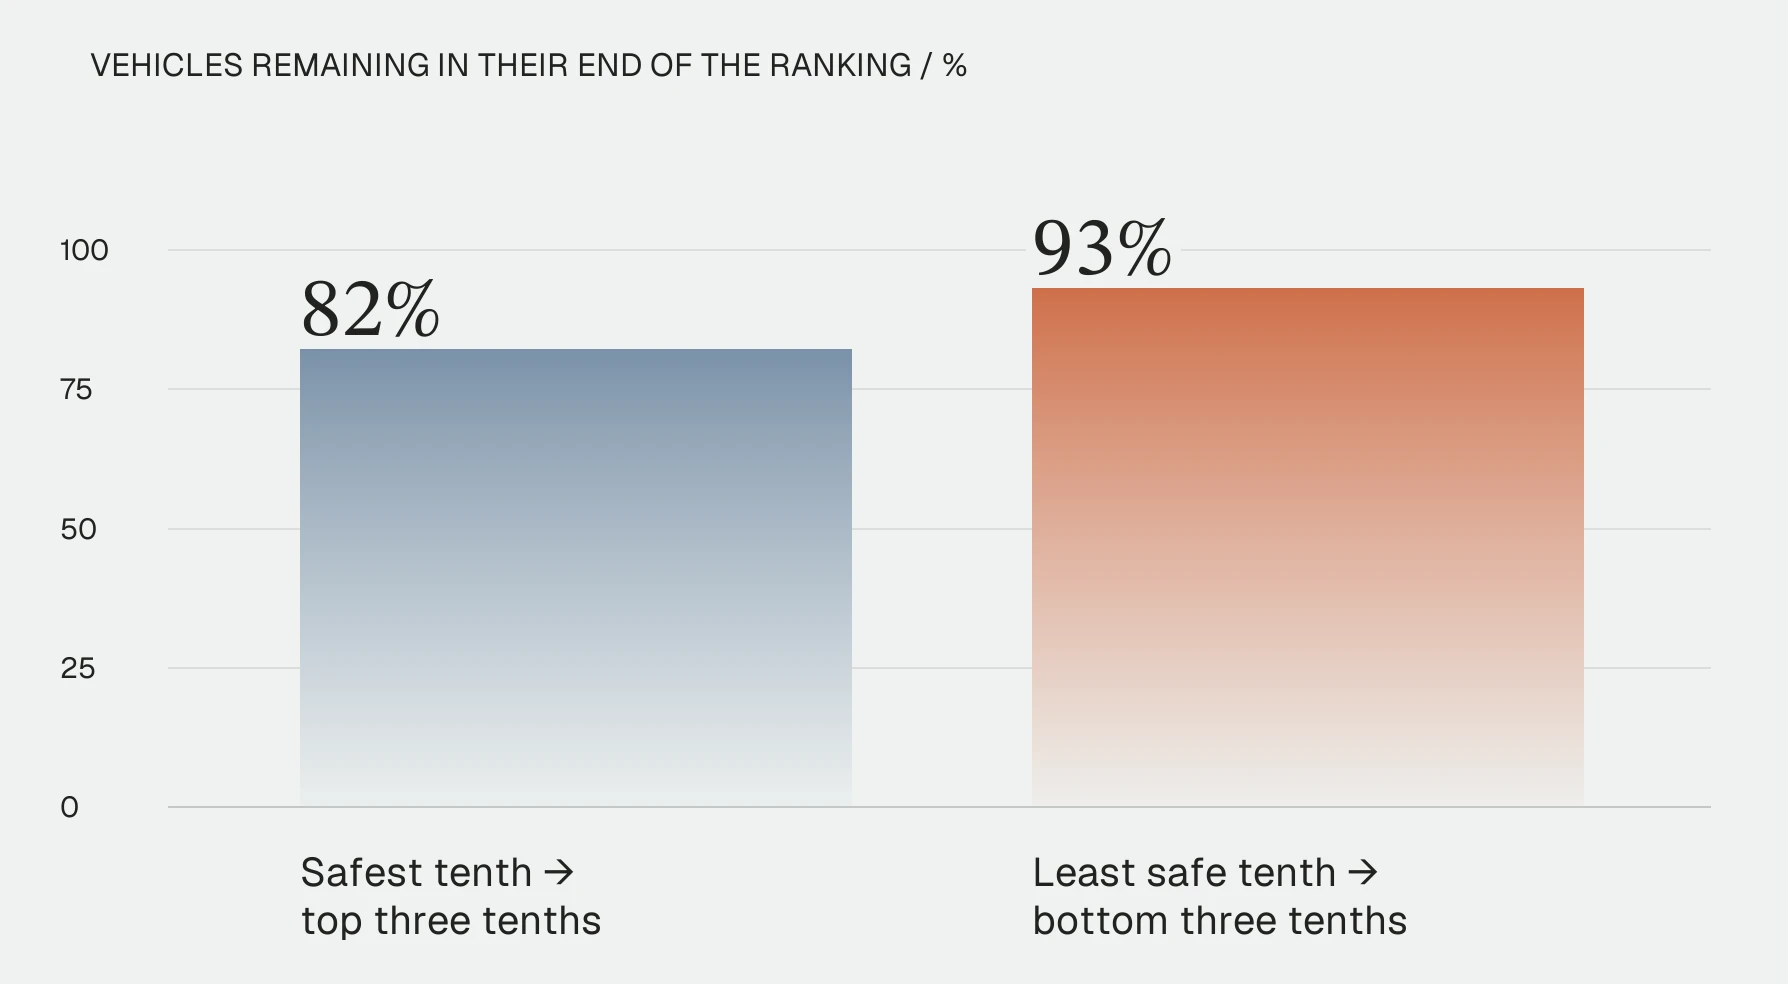
Zero-based scale: 0–100%. Tested on driving the ranking had not seen.
82%
Of the safest tenth stayed in the top three tenths six months later.
Safe driving here is not a good quarter. It’s a stable characteristic of how a vehicle gets used, and it’s identifiable in advance.
A second measure agrees, and we didn’t rank on it
Hard braking is a useful signal, but it is not a crash. So we checked the ranking against something else entirely: high-G impacts, the strongest jolts in the data, which played no part in deciding who ranked where.
The safest tenth logged 72% fewer of them per mile.
That’s the result that matters most, because it came from a measure we never optimized for. Vehicles picked purely on smooth braking also turn out to experience far fewer real impacts.
−72%
High-G impacts per mile, a measure they were not ranked on.
Where
The Midwest is over-represented among the safest vehicles, at 17% of them against 6% of the least safe, and runs at about two-thirds of its expected braking rate.
Eleven cities with heavy mileage stayed below expectation on every test we ran: Louisville, Jacksonville, El Paso, San Antonio, Phoenix, Irving, Vancouver in Washington, Wichita, Yuba City, Amarillo and Kingman.
One honest note on that list. We tested 63 cities three different ways, and at that volume roughly nine labels would turn up by chance alone. These eleven cleared every test, which is why they’re the ones named, but a single year is a single year.
What this study cannot tell you.
Our unit is a vehicle, not a person. A shared vehicle carries several drivers and we can’t separate them, so every finding here describes vehicles and the way they get used.
Hard brakes are a risk signal, not a crash rate. We are not claiming these vehicles had fewer collisions, only that they braked hard far less and took far fewer hard knocks.
And about one camera in nine sent no motion events at all over the whole year. Almost none of those also reported cornering or acceleration, which points at a device that isn’t reporting rather than a driver who never brakes. We excluded them rather than counting them as perfect. That means a genuinely flawless low-mileage driver was excluded too, and it’s the reason we treat the top of this ranking as conservative.
Why we built it this way
The first version of this analysis said the safest vehicles in America were semi trucks on open highway. We could have published that. It would have been technically accurate and completely empty.
What’s here instead took the long way around, and the payoff is a list of habits that a person can actually copy.
Source: EE, Safest Million Miles Data Pull Copy, “Safest Miles” tab. 423M miles across 26,830 vehicles. Editorial adaptation.