Case study
We went looking for deer season. We found the clock.
One mile in twelve that our fleet drives runs past forest in the countryside. We measured what happens to braking on those roads when the days get short, expecting to find November. We found something longer.
November is the peak of the white-tailed deer rut across most of the United States, and it’s the month everyone warns about. Published research counts more than a million deer-vehicle collisions across 23 states, with roughly 2.1 million a year nationally.
So we asked a specific question. On rural roads beside forest, does hard braking concentrate at dawn and dusk during deer season more than it does on city streets over the same weeks?
To answer it we tagged every hard brake in the fleet by road type and by how far it fell from that location’s own sunrise or sunset, then compared October and November against August and September.
2.1M
Deer-vehicle collisions a year nationally, roughly
1M+
Counted across 23 states in published research
23
States in the published count
First, the road itself
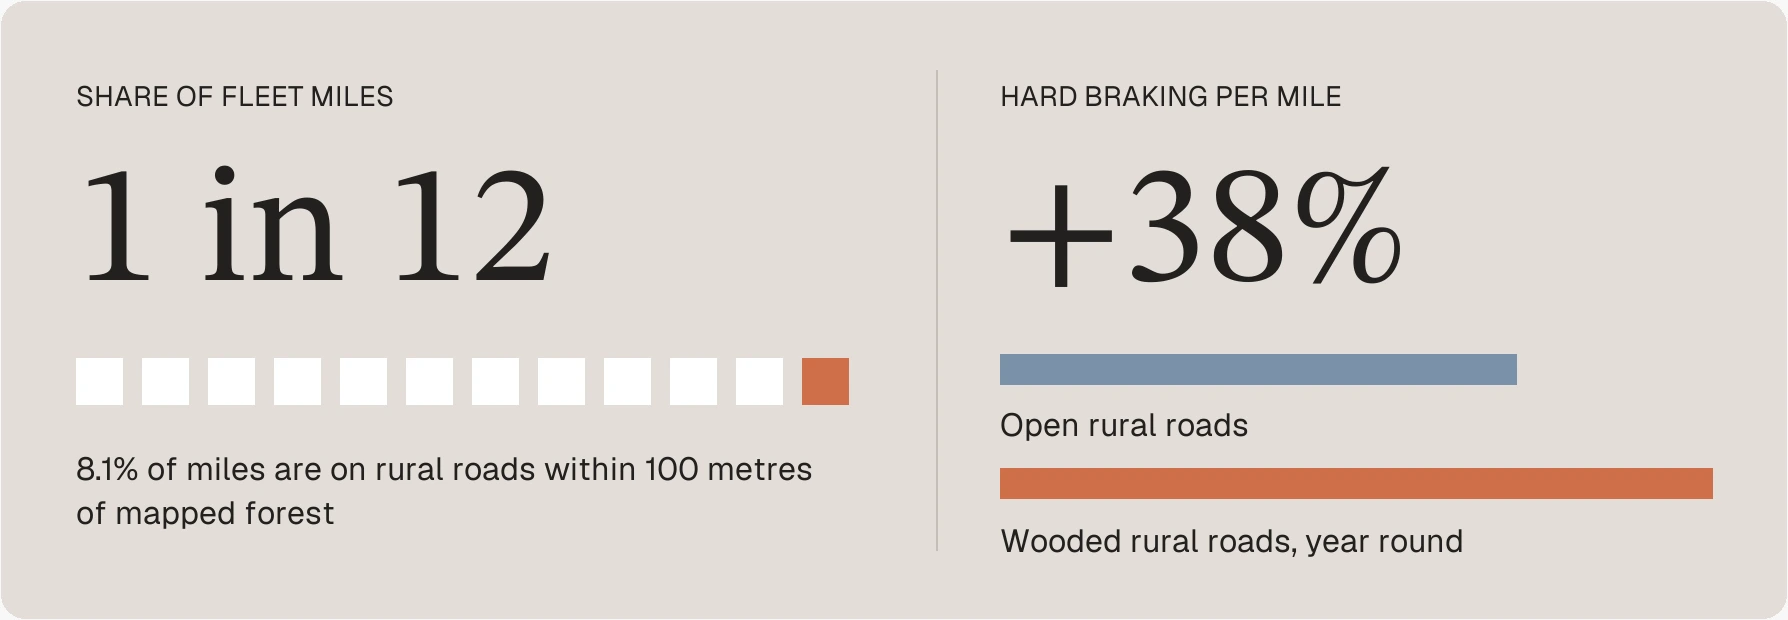
About 8.1% of the miles our fleet drives are on rural roads within 100 metres of mapped forest. One mile in twelve. Whatever happens on those roads touches a lot of ordinary trips.
Those roads are already harder than their open-country neighbours. Per mile, hard braking on wooded rural roads runs 38% above rural roads without trees, and that gap holds in late summer, well before the rut. Wooded roads are curvier, narrower and have shorter sight lines. That’s a property of the road, not of the season.
It also means any hazard that arrives after dark lands on top of a road that was already demanding.
Then, the dark
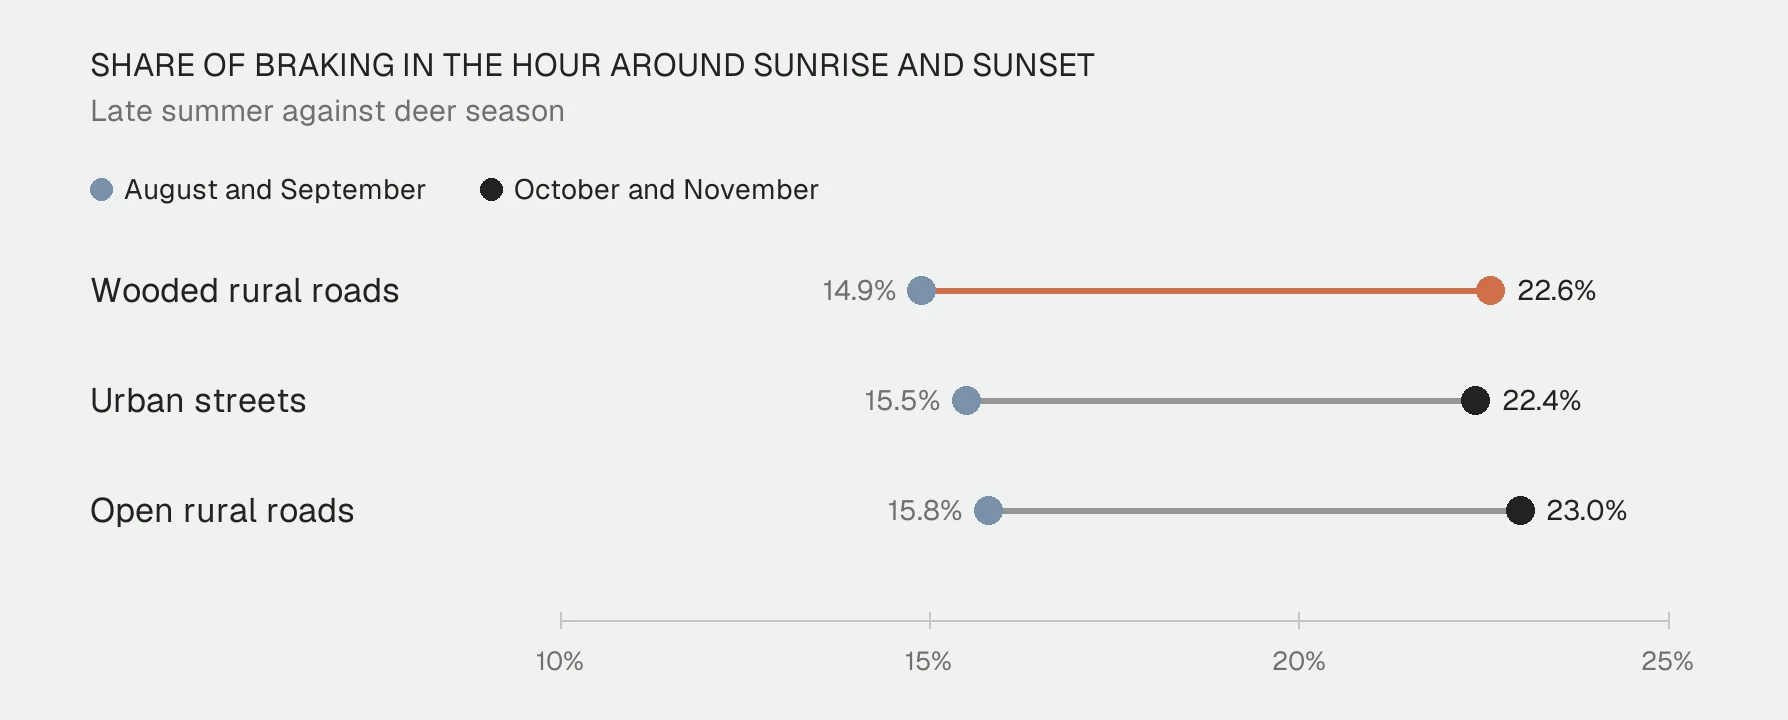
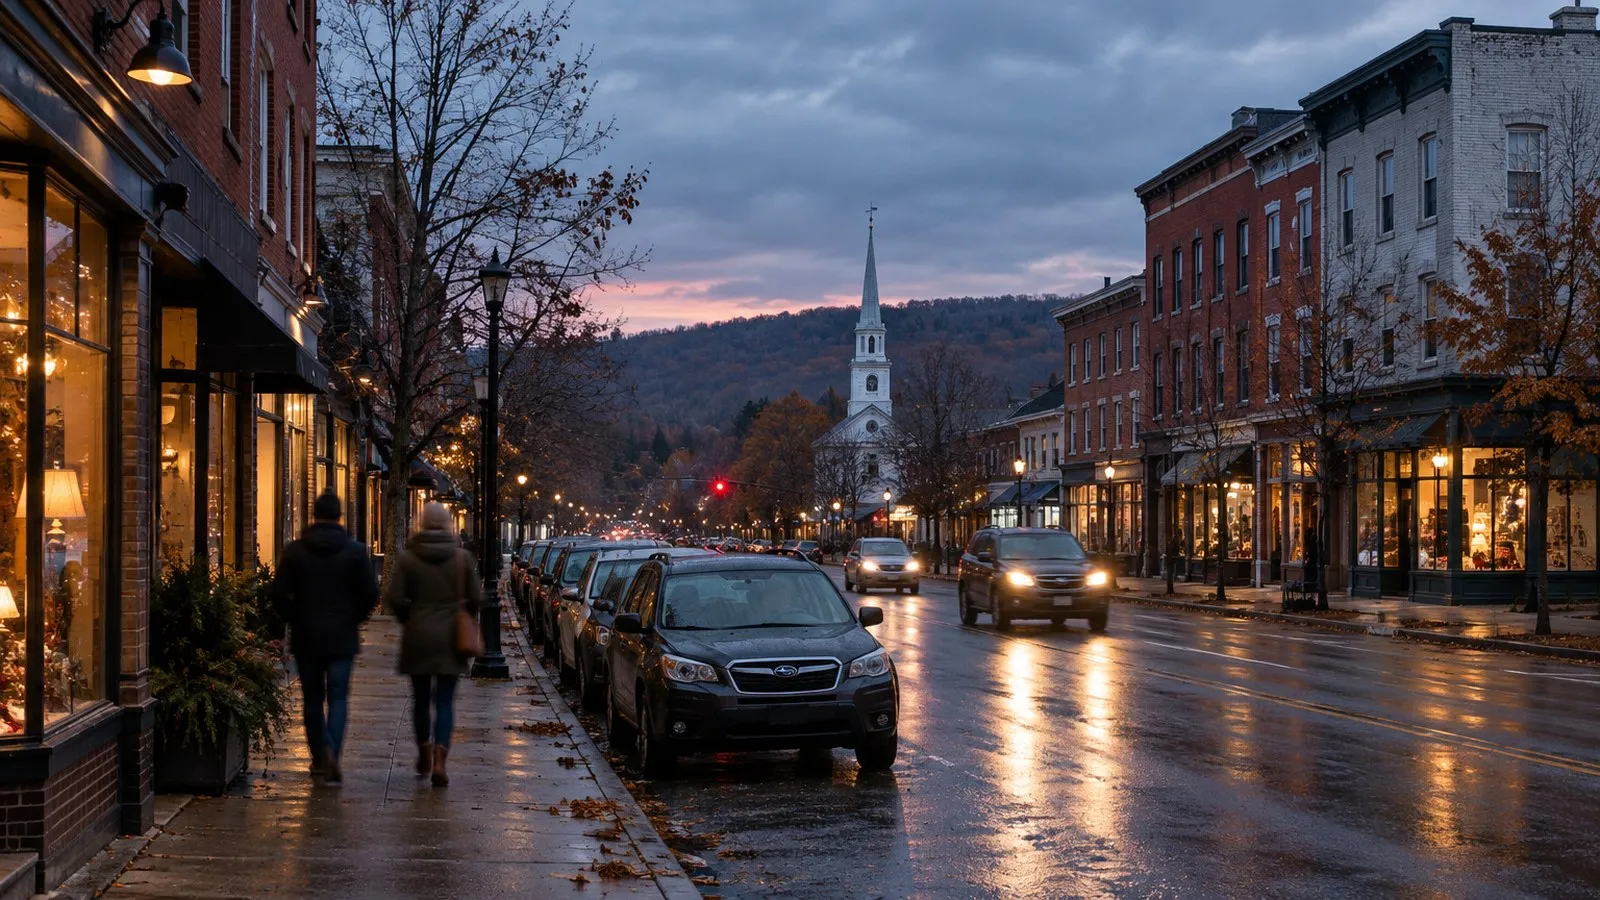
Between late summer and deer season, every road type moved about half again more of its braking into the hour around sunrise and the hour around sunset. Wooded rural roads went from 14.9% to 22.6% of their braking in those windows. Urban streets went from 15.5% to 22.4%. Open rural roads went from 15.8% to 23.0%.
Three very different kinds of road, one near-identical shift. The sun had started setting inside the evening commute.
≈1.5×
About half again more braking around sunrise and sunset, on every road type
Wooded roads moved a little further, and toward dusk
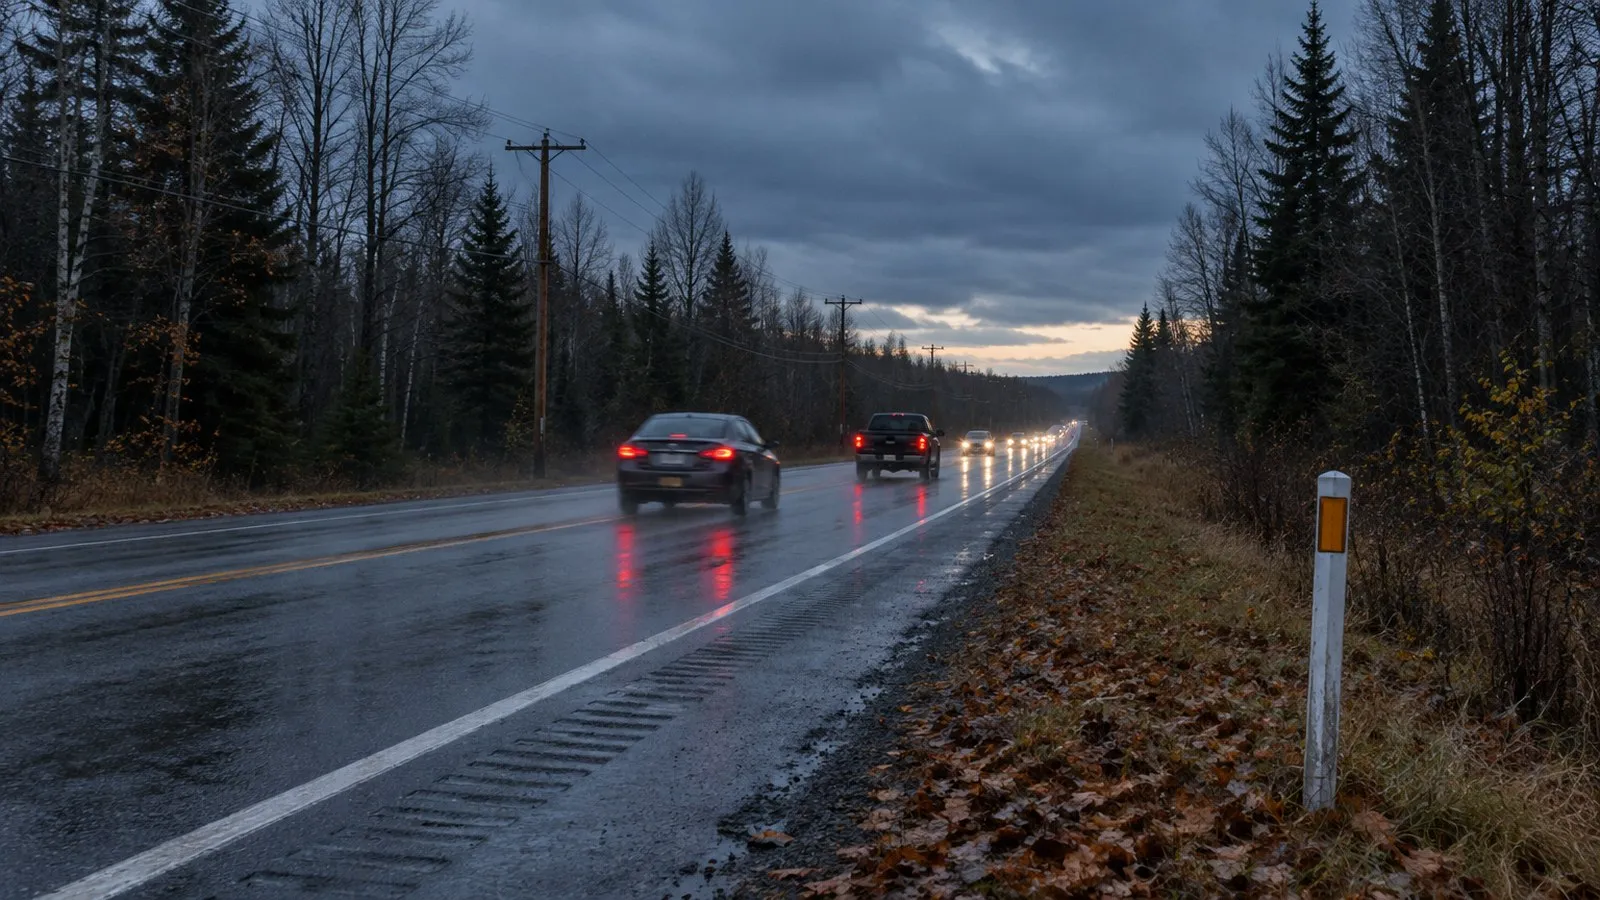
Beyond that common shift, wooded rural roads leaned about 12% further into dusk and darkness than urban roads did, and not at all further into dawn.
On its own, that looks like the deer story. Dusk, wooded roads, autumn.
≈12%
Further into dusk and darkness than urban roads
0
Further into dawn
3
Road types, one near-identical seasonal shift
Then we ran the same comparison in February
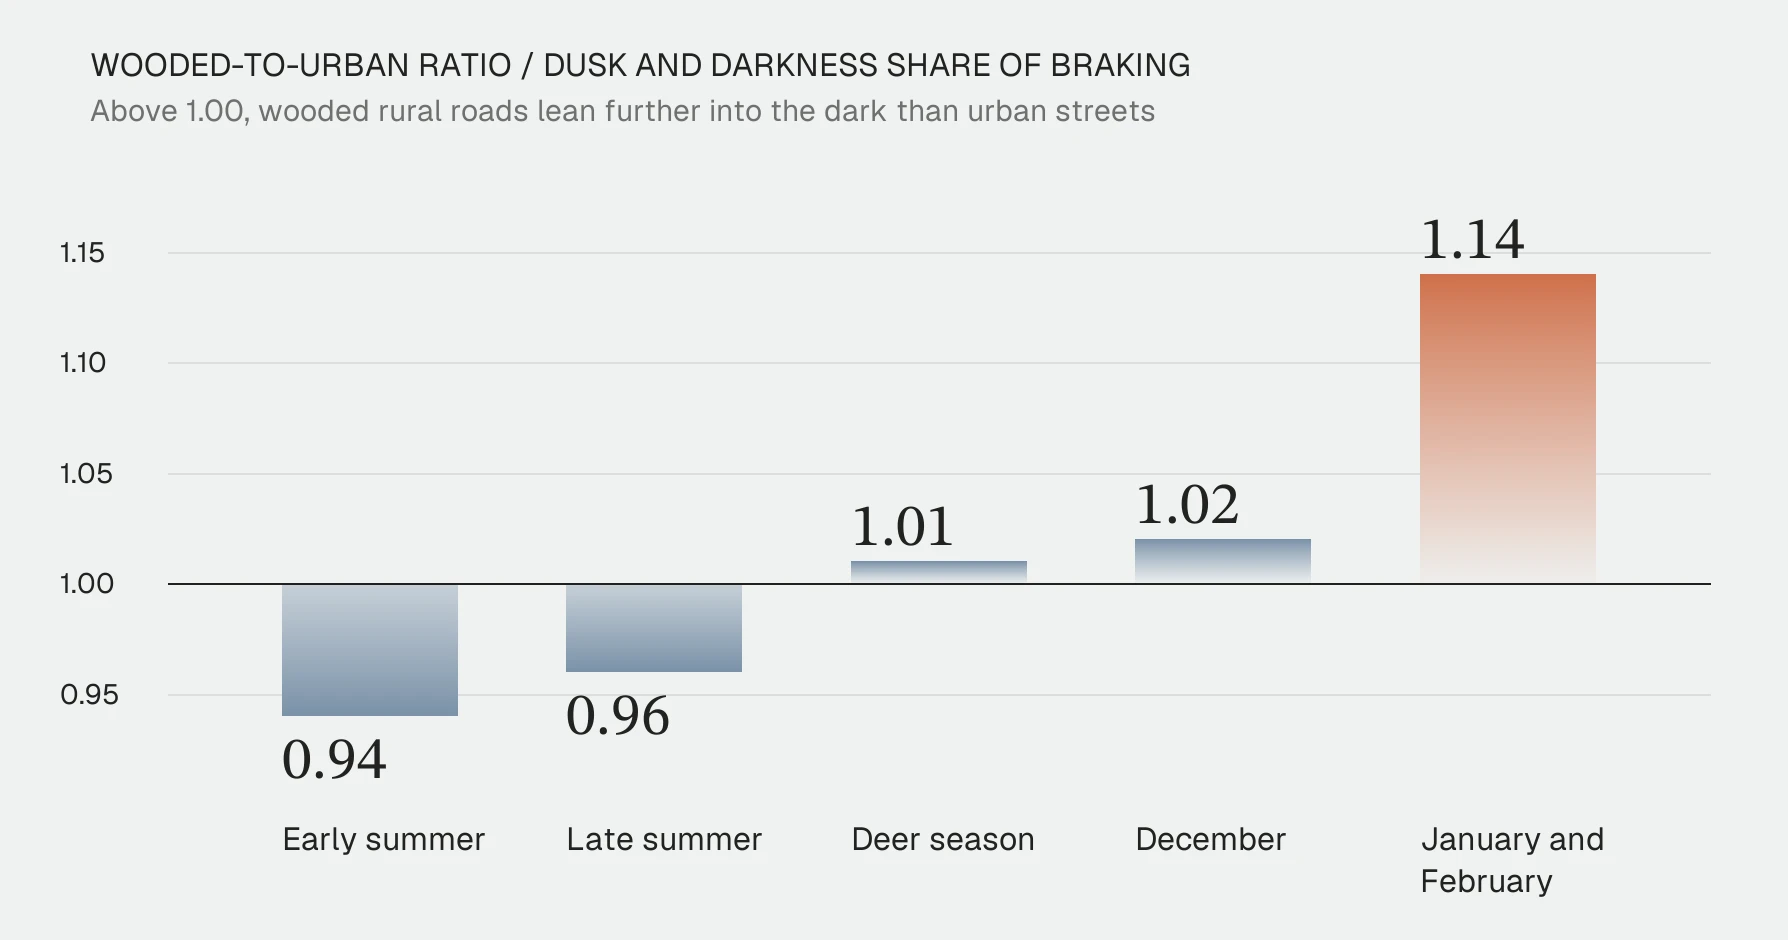
If the rut were driving it, the gap should peak in October and November and fade by the new year.
It doesn’t fade. It grows.
The wooded-to-urban ratio runs 0.94 in early summer, 0.96 in late summer, 1.01 in deer season, 1.02 in December, and 1.14 in January and February. The highest reading of the year falls in the months when deer movement is at its annual low.
The snow test
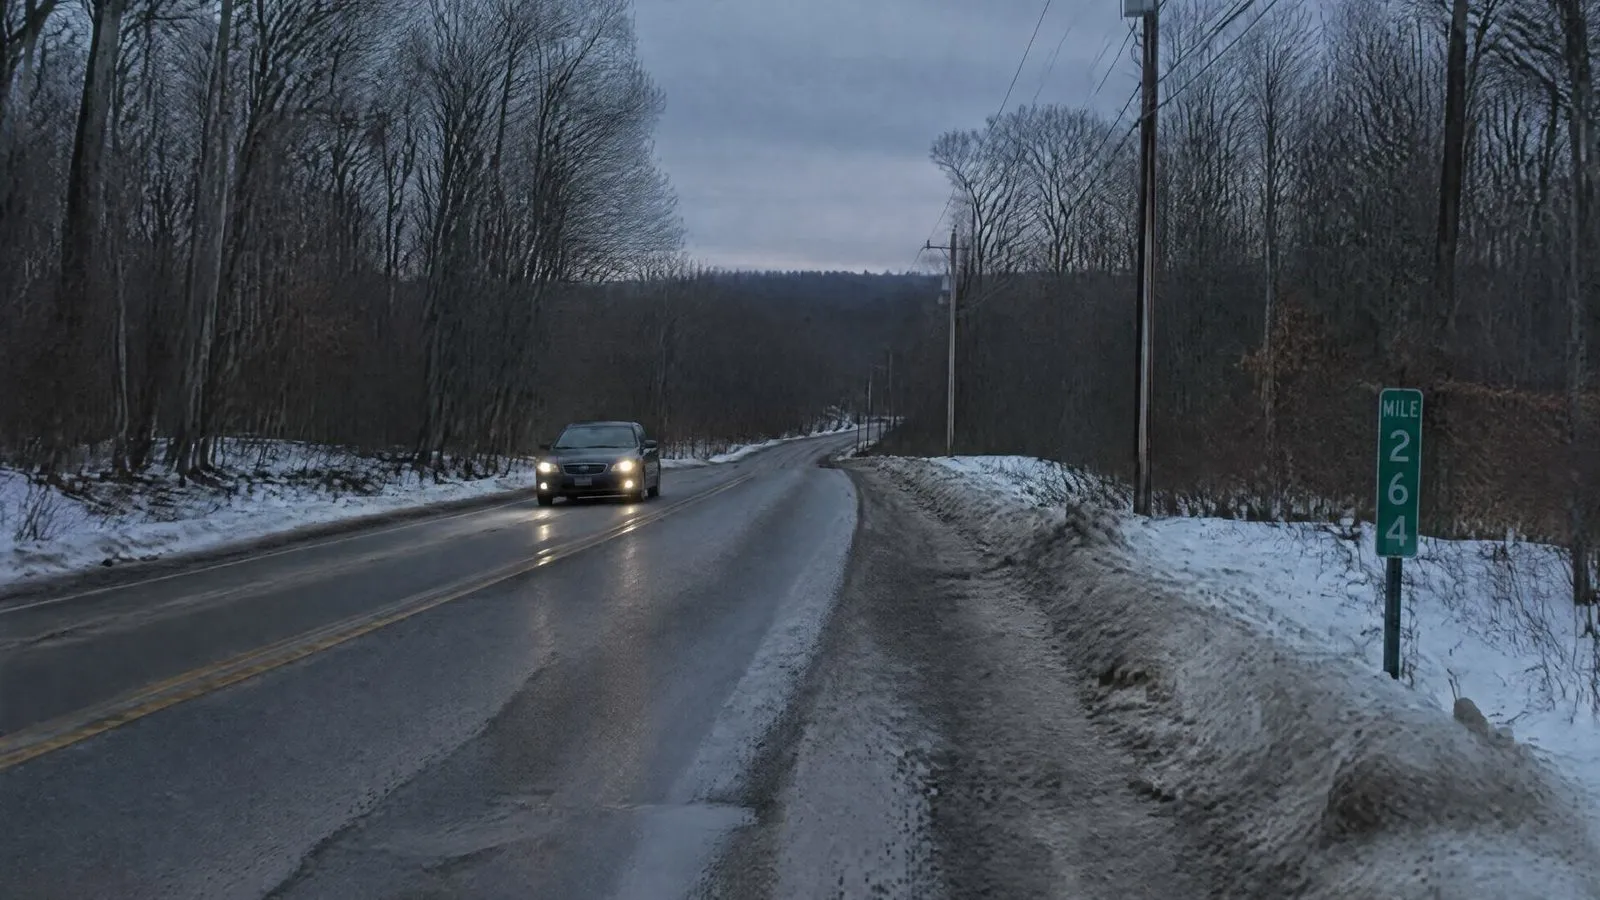
We checked snow too, since early northern snowfall might explain it. The dusk-and-darkness gap is 13.3% north of the 40th parallel and 14.1% south of it. If anything it’s slightly larger where November snow is rare.
13.3%
Dusk-and-darkness gap north of the 40th parallel
14.1%
South of it, where November snow is rare
The pattern tracks the length of the day, not the rut.
What that means if you drive these roads
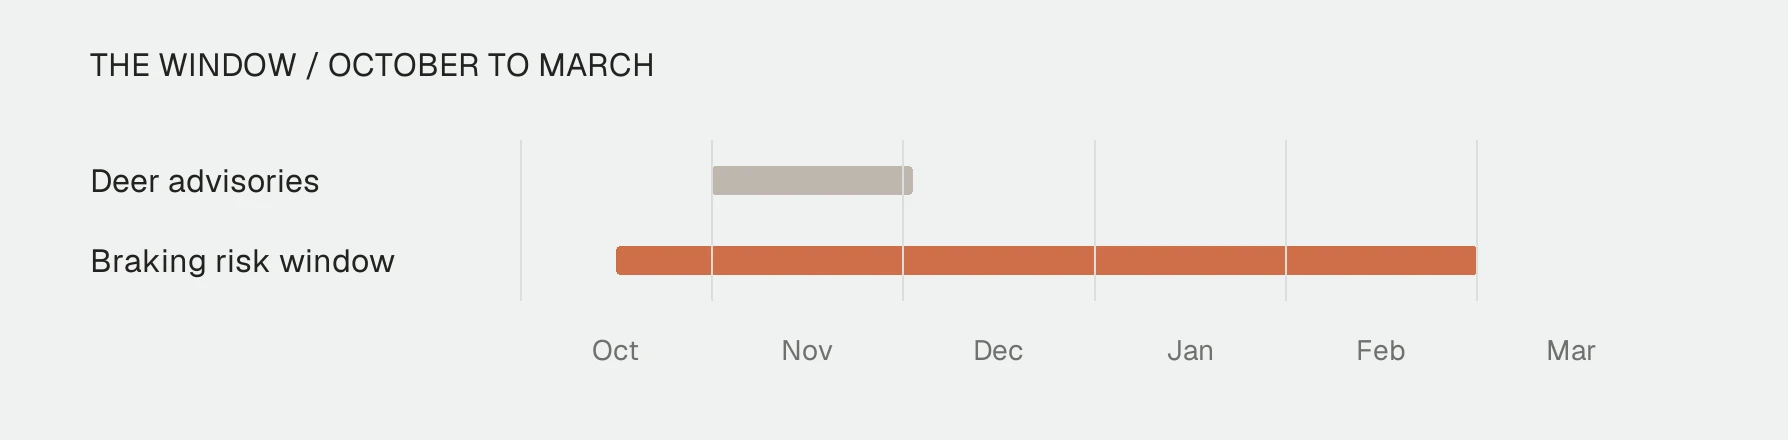
The window to watch is the hour around sunset and the darkness after it, on wooded rural roads, from mid-October through the end of February.
That’s the practical correction. The warnings arrive in November and stop in December. The braking data says the risk window is more than twice that long and is still widening when the deer advisories have gone quiet.
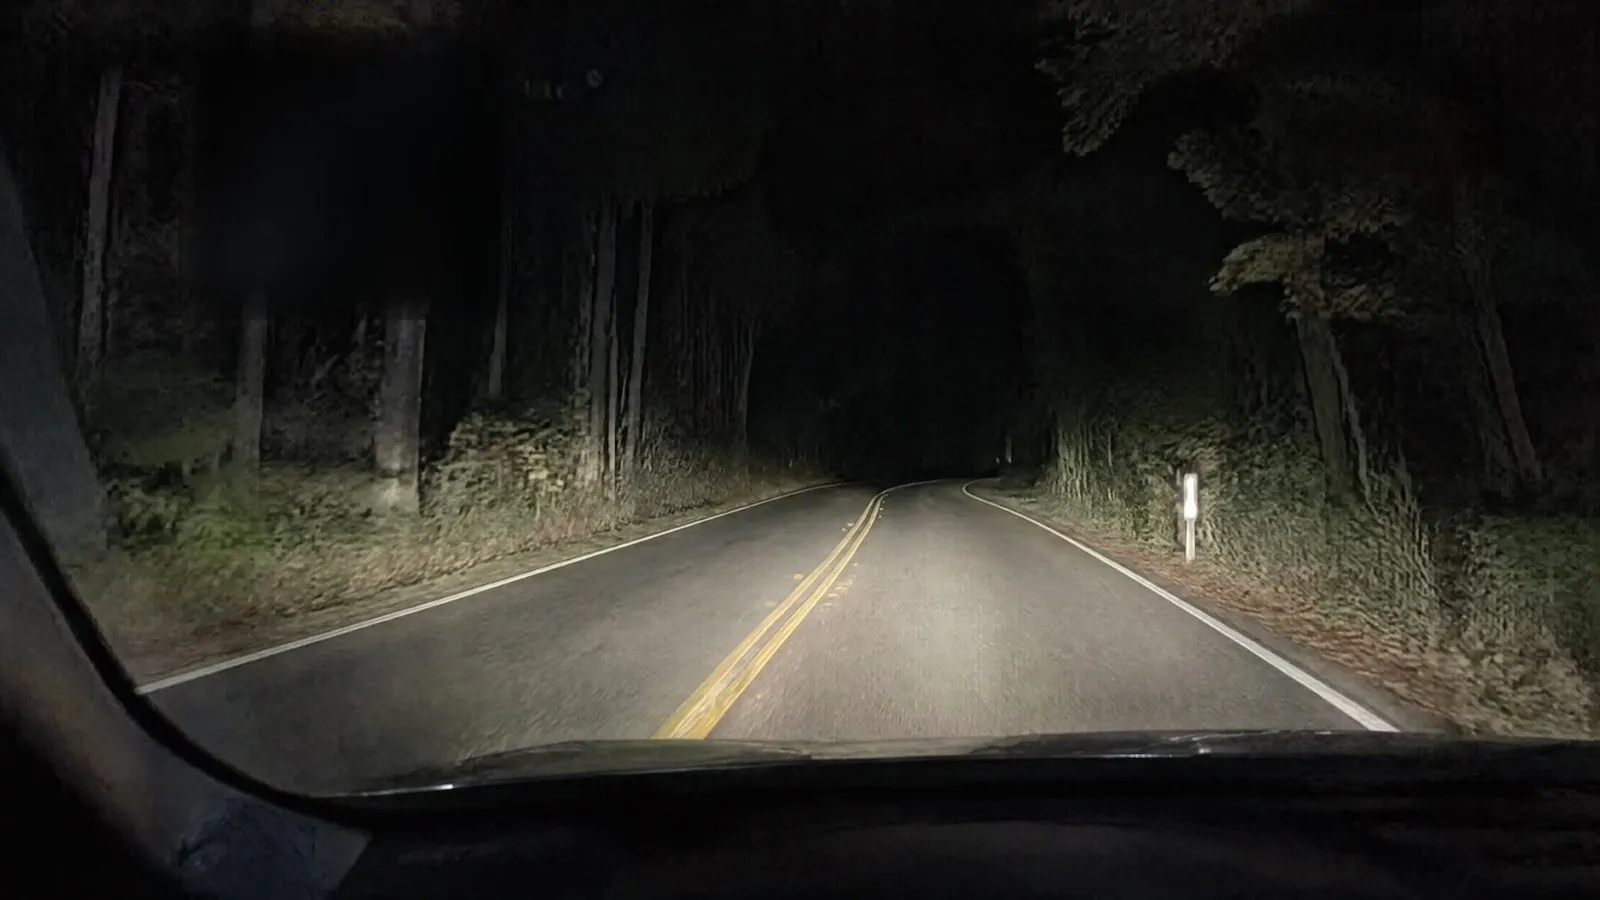
For a driver: lower speed, high beams where traffic allows, and eyes on the road edges rather than just the lane.
For anyone running rural routes: the first hours after sunset, October through February, are the legs worth moving if the schedule allows.
This advice holds whether the thing in the road is a deer, an unlit cyclist or a curve arriving faster than expected. Our data cannot tell those apart, which is exactly why the advice is about the conditions rather than the animal.
Where we agree with the published record
The strongest study on this found deer-vehicle collisions 14 times more frequent two hours after sunset than two hours before, and a 16% jump in collisions the week after clocks go back.
Our dusk-and-darkness shift, between 12 and 17 percent, is close to that 16% in size. The direction matches exactly: risk moves into the dark.
Where we differ is attribution. Collisions need a deer. Braking doesn’t. A hard brake records any hazard a driver sees in the dark, and our season test shows the shift continuing into February, which is what a darkness effect predicts and a rut effect does not.
What this study cannot tell you
It cannot detect an animal. No camera in this study identified a deer, and nothing here counts deer strikes.
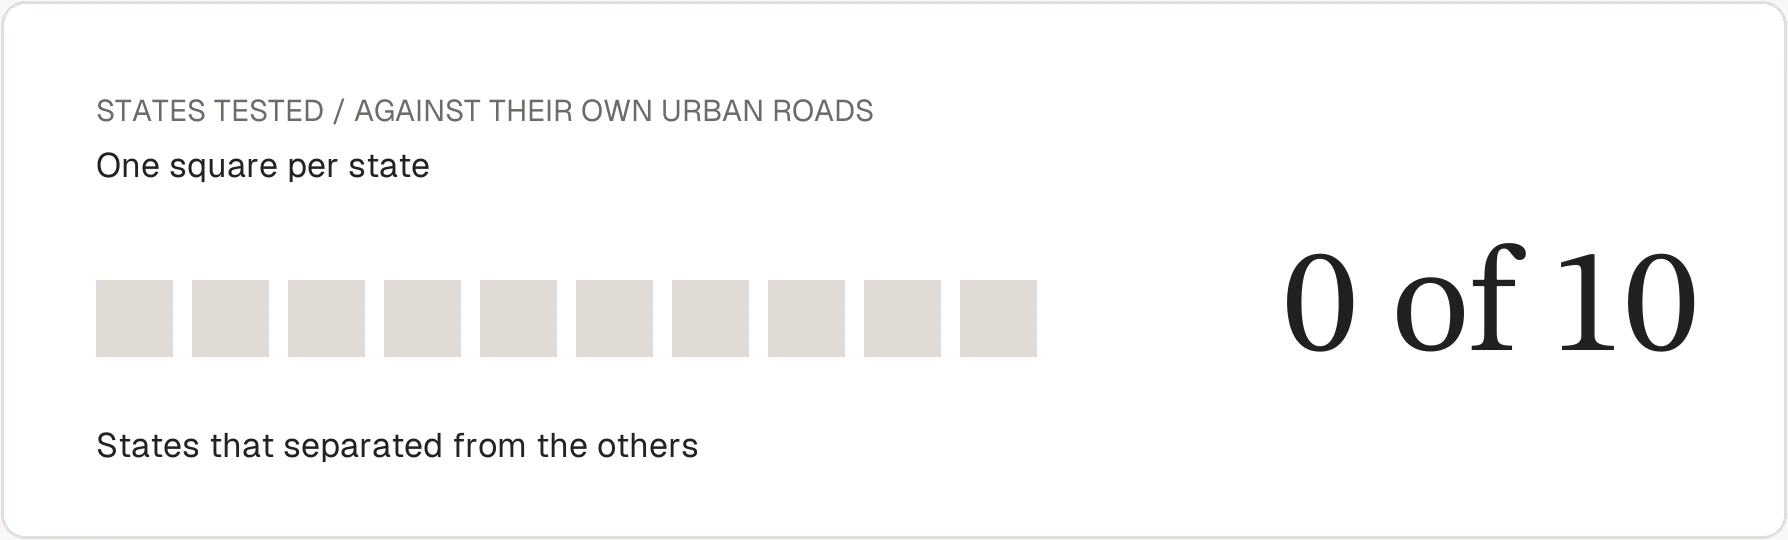
It cannot give you a map. Naming the states or corridors where deer-pattern braking concentrates would need per-mile rates on wooded roads through deer season, and that mileage doesn’t exist in our records for those months. We tested ten states against their own urban roads and not one separated from the others. A list built on these numbers would look authoritative and mean nothing.
It cannot rule out deer either. Some deer-related braking is almost certainly inside these figures. It just can’t be pulled out from the season it sits in.
The study in numbers
1 in 12
Miles the fleet drives on rural roads beside forest
8.1% of all miles
+38%

More hard braking per mile on wooded rural roads than open rural ones
Year round, not seasonal
22.6%vs22.4%

Share of braking at dawn or dusk in deer season
Wooded rural roads vs urban streets
1.14

Wooded-to-urban ratio in January and February
The year’s highest, when deer move least
+12.5%

How much further wooded-road braking moved into dusk and darkness than urban roads did
143,060
Hard brakes measured in deer season