
Empiric Earth launches today. Along with everything else a launch produces, here is the part that usually gets skipped: how to check whether any of it is true.
Every data pitch makes the same four claims: It is real. There is a lot of it. It is current. It covers the situations that matter. Every one of those claims is usually sincere, and I have never seen a buyer with a reliable way to check any of them. Until now.
So I am going to keep this narrow on purpose. Not data in general. Road data. Vehicles, drivers, hazards, and what happened next. That is what Nexar and Nauto each spent eleven years observing, it is the hardest environment I know of to record honestly, and it is the one I can speak about without hedging.
No other technology purchase works this way. When you buy compute, you can benchmark it. When you buy a model, you can evaluate it against a known dataset. When you buy road data you get a number of miles, a map with some shading on it, and an assurance.
An assurance cannot be tested. That is the problem with it, and it is not a small one when the thing being built on top will make decisions at speed on a public street.
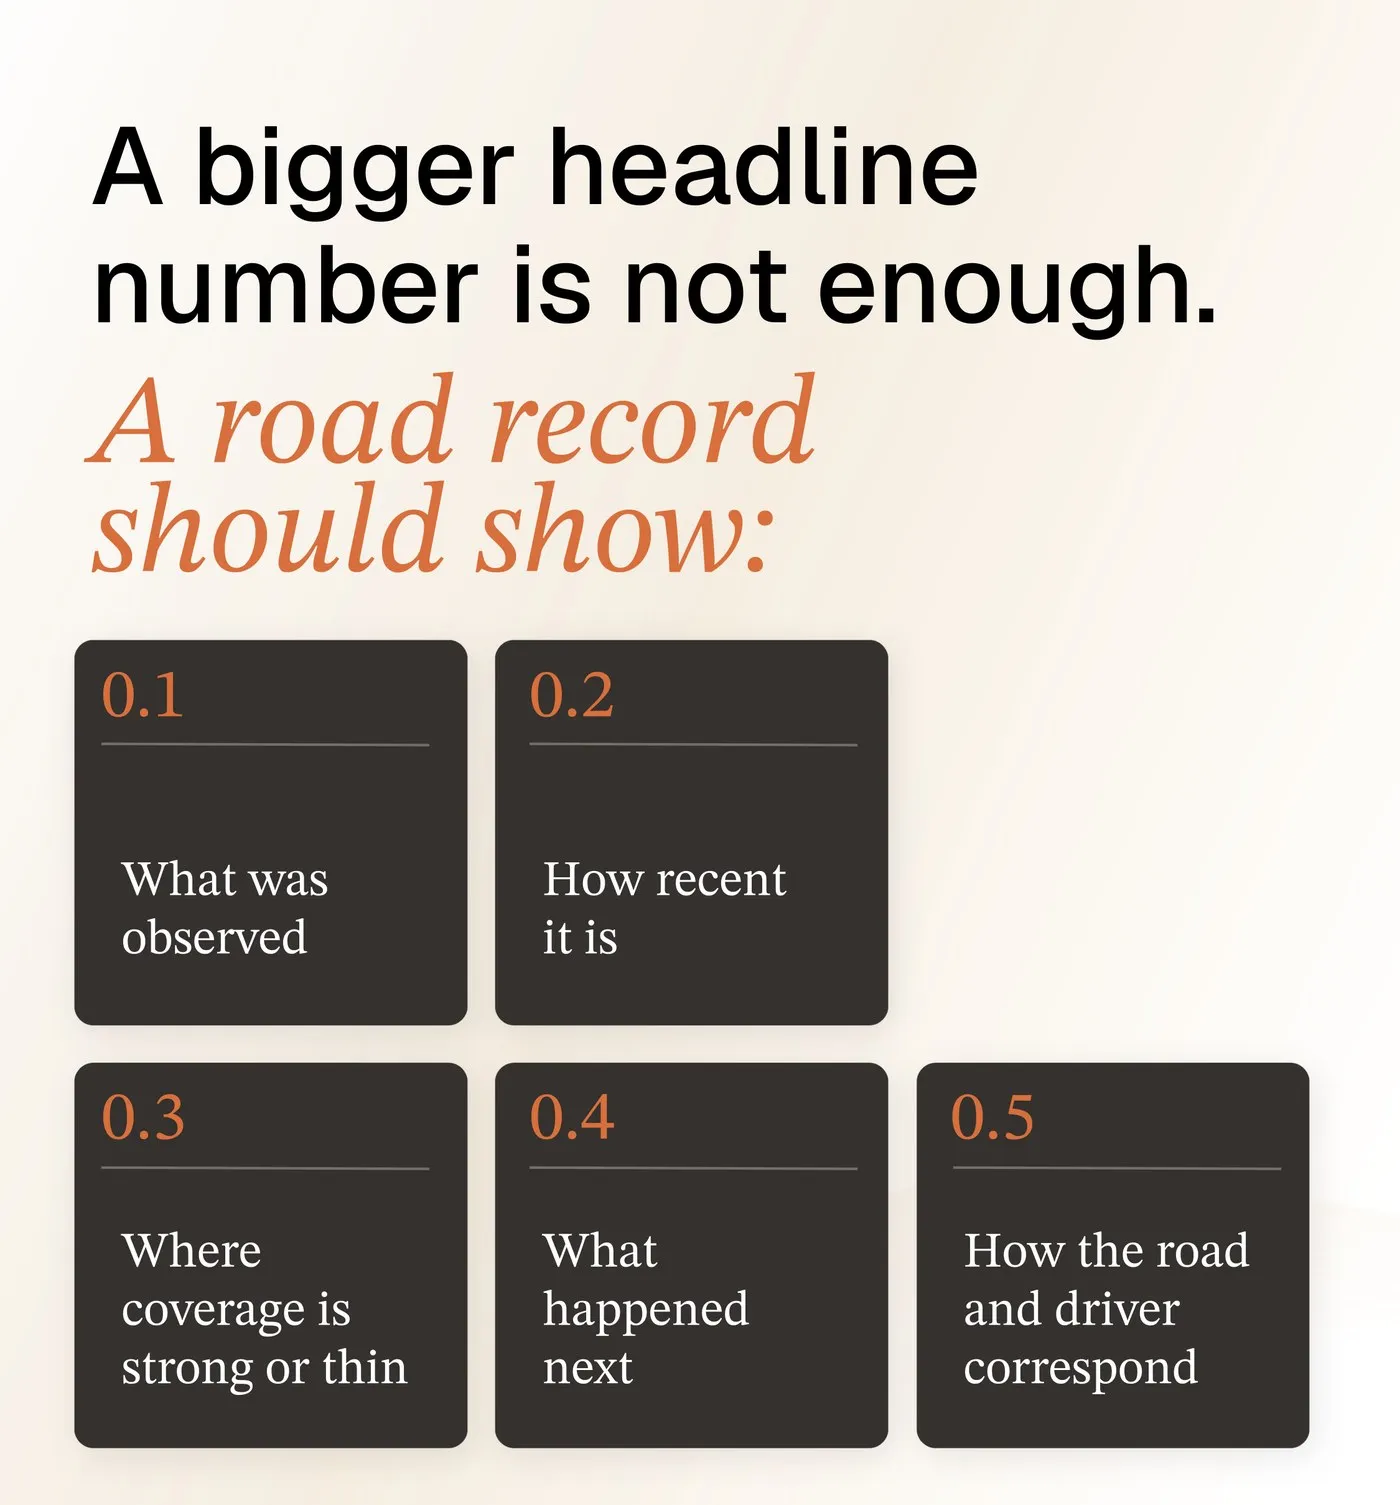
So here are five properties road data has to have to be worth building on, and the specific question that tests each one.
These five apply to any dataset. I am writing about roads because roads are where they are hardest to satisfy: an environment nobody controls, rare events that arrive at the world's pace rather than yours, and outcomes that cost real money to know.
Three of the five test one of those four claims. The other two test things nobody bothers to claim, and those are the two I would ask about first.
They are written to be asked of anyone, including us. At the end I have answered all five for our own record. That is the point.
Two arguments, however, I am setting aside. Whether a supplier should grade its own data is a question about institutions, argued elsewhere on this site. Whether a simulator can substitute for observation is a question about generative limits, also argued separately. This piece assumes you have decided you need real road data, and it is about how you tell one record from another.

1) Provenance, as a fraction
The question: how much of this was observed, how much was generated, and can you break that down by type of event?
Tests the claim that it is real.
Almost every serious road dataset is now mixed. Observation gets augmented. Rare classes get synthesized to balance a training distribution. There is nothing wrong with that, and anyone who tells you their data is one hundred percent observed is either not counting the augmentation or is not the person doing the counting.
The problem is not that the mixture exists. It is that the mixture is almost never broken out by event type, and event type is where it matters.
Here is what that looks like in practice. A supplier can tell you truthfully that their record is ninety percent observed. Then you ask for the class you are actually buying it for, which might be a pedestrian stepping out from between parked cars at dusk, and it turns out that particular class is thin in the real data and was filled in almost entirely with synthetic examples, because it was the easiest place to justify doing so. The headline number was accurate. The number you needed was the opposite.
Ask for the split by class. If it cannot be produced, that means nobody has audited the record at that level. Including, on this one, us.
2) Recency, as a distribution
The question: what is the age distribution of the records behind this claim, not the date of your last refresh?
Tests the claim that it is current.
Refresh dates are close to meaningless on their own. A dataset can refresh nightly and still answer a question about an unusual maneuver in heavy rain using observations from four years ago, because the common cases refresh constantly and the rare ones almost never do. The freshness you are quoted describes the head of the distribution. The decisions you care about live in the tail.
The road does not hold still, and it does not decay uniformly. Road geometry changes slowly. Signal timing, work zones and traffic patterns change in weeks. Vehicle behavior changes as the fleet turns over.
So ask for the histogram. Then ask what the useful half-life of each class is believed to be, and whether anything in the system flags a claim that has aged past it. Most systems have no such flag. A model trained in March is still reasoning about a March world in November, and nothing in the pipeline says so.
3) Coverage of the tail, as a rate
The question: how many events per million miles do you hold in the class I actually care about, and what is that in raw count?
Tests the claims that there is a lot of it and that it covers what matters.
Total mileage is the vanity metric of this industry, and it is the wrong number for a simple reason: it measures how far you drove, not how much of what you saw was new.
Most driving is repetitive. Fleets run the same lanes. Consumer devices concentrate in the same metros. A very large number of miles can contain a very small number of distinct situations, and two records with identical mileage can be radically different records.
The useful question is density in the class you need, and an honest answer has two numbers in it. A rate, so you can compare one supplier to another. A raw count, so you can tell whether that rate is being carried by a sample too small to trust.
If the answer comes back as a total mileage figure, it is an answer to a different question. We will publish a total mileage figure ourselves today, because it is true and because it is the number a launch asks for. It is not the number to buy on. Ask us for the rate in the class you care about and we will give you that instead.
4) Outcome labels, and how the outcome was established
The question: for what fraction of these events do you know how it ended, and how do you know?
No supplier claim corresponds to this one. That is the first of the two gaps.
Most road datasets record what a sensor saw. Far fewer record what happened next. The difference is enormous, because a record of perception teaches a system to perceive and a record of outcomes teaches it what to do.
An example of what that costs. We are currently hand-labeling outcomes on a subset of long-tail events, specifically the ones that ended well, so the next generation of our collision-anticipation model can learn from near misses that resolved rather than only from the ones that did not. There is no automated way to do that. Someone watches the clip and writes down what happened. It is slow, expensive work with no shortcut, which is why most records do not have it.
Outcome labeling is uneven by nature. It is strongest where somebody on the other end reported back, which in practice means managed deployments where an operator has a reason to close the loop. It is weakest everywhere else. That unevenness is not a flaw to hide. It is a property of the record that tells a buyer which questions the record can answer.
Ask what fraction carries an outcome. Then ask how it was established, and listen for whether it was observed, reported, or inferred. All three are legitimate. Only one of them is evidence.
5) Correspondence, or whether it is one record at all
The question: can you tell me the interval between the moment a hazard became visible and the moment the driver responded?
No supplier claim corresponds to this one either, and it is the question I would ask first.
It sounds like a question about a metric. It is a question about architecture. Producing that interval requires two observations of the same second, one facing the road and one facing the driver, reconciled to a common timeline precisely enough that the gap between them means something. A supplier whose road-facing and driver-facing data live in completely separate systems cannot produce it, no matter how large either one is.
The interval sits between the road and the driver rather than belonging to either, and that is where the loss occurs.
A system that can measure it can tell the difference between a pedestrian near a curb with the driver already looking at them, and the identical scene with the driver looking elsewhere. A road-facing camera sees the same picture in both cases and has no way to tell them apart.
A supplier who cannot produce that interval holds two datasets rather than one record, whatever the sales material calls it.
Our own answers. All of them.
I would not publish this list on the day we launch without answering them too.
Provenance. Nothing generated sits in the record itself. No imagery and no sensor data is synthesized. What we do infer algorithmically are attributes about the capture: what type of vehicle the camera is on, where it is mounted, how the clocks align, and similar. Those inferences are labeled as inferences.
The split by event class is the honest gap. Everybody wants that number and we cannot produce it yet, because producing it honestly would require human review across the whole record, and there is no automated method today that would give an answer I would stand behind. I would rather say that plainly than publish an estimate dressed as a measurement.
Recency. We can produce an age distribution across the record as a whole, and we can produce one for individual classes that are well characterized. We cannot yet produce it for every class, which is the version that would fully answer my own question. That is a real limitation and it is the one I would most like to close.
Tail coverage. Thinner than I would like in a few places, and one of them is not obvious.
We are thin on events involving motorcades. Nobody is going to manufacture more of them, and we cannot go back and collect last year's. That is what a genuine gap in a road record looks like: not a missing feature, a missing set of days that already happened.
Outcome labels. Strongest in managed fleet deployments where an operator reported back. Weaker across the broader record, and the manual labeling described above is our attempt to close some of that on the classes that matter most. This is the property where the unevenness is largest, and it is the one I would push hardest on if I were buying from us.
Correspondence. We can produce the interval, and only on the subset of the record where both cameras exist and are synchronized. That is the managed fleet deployments, where the vehicles carry paired inward and outward cameras and the alerting already depends on driver state. It is not the consumer dashcam record, where in most cases there is no inward-facing view at all.
That boundary matters and I want it stated rather than assumed. We hold a very large road record. The part of it that can answer question five is a subset of that, and anyone who tells you otherwise about their own record should be asked which subset.
What would change my mind
If generated environments reach the point where a system trained entirely inside them transfers to unfamiliar real conditions without degradation, most of this framework becomes a historical curiosity and I will say so here. I do not expect it soon. The barrier is not visual fidelity, which is close to solved. It is that generated worlds contain the situations somebody thought to put in them, and the situations that cause serious outcomes are, definitionally, the ones nobody thought of.
The second is more uncomfortable. If a record that scores badly on all five of these still produces systems that work, then the five properties are not measuring what I think they are, and the framework is wrong rather than incomplete. That is the kind of result that tends to arrive late.
The ask
Publish your scores.
Not a case study. Five numbers, with the definitions attached, updated on a schedule, including the ones that argue against you.
Anyone making those four claims should be able to answer these five. We have gone first.