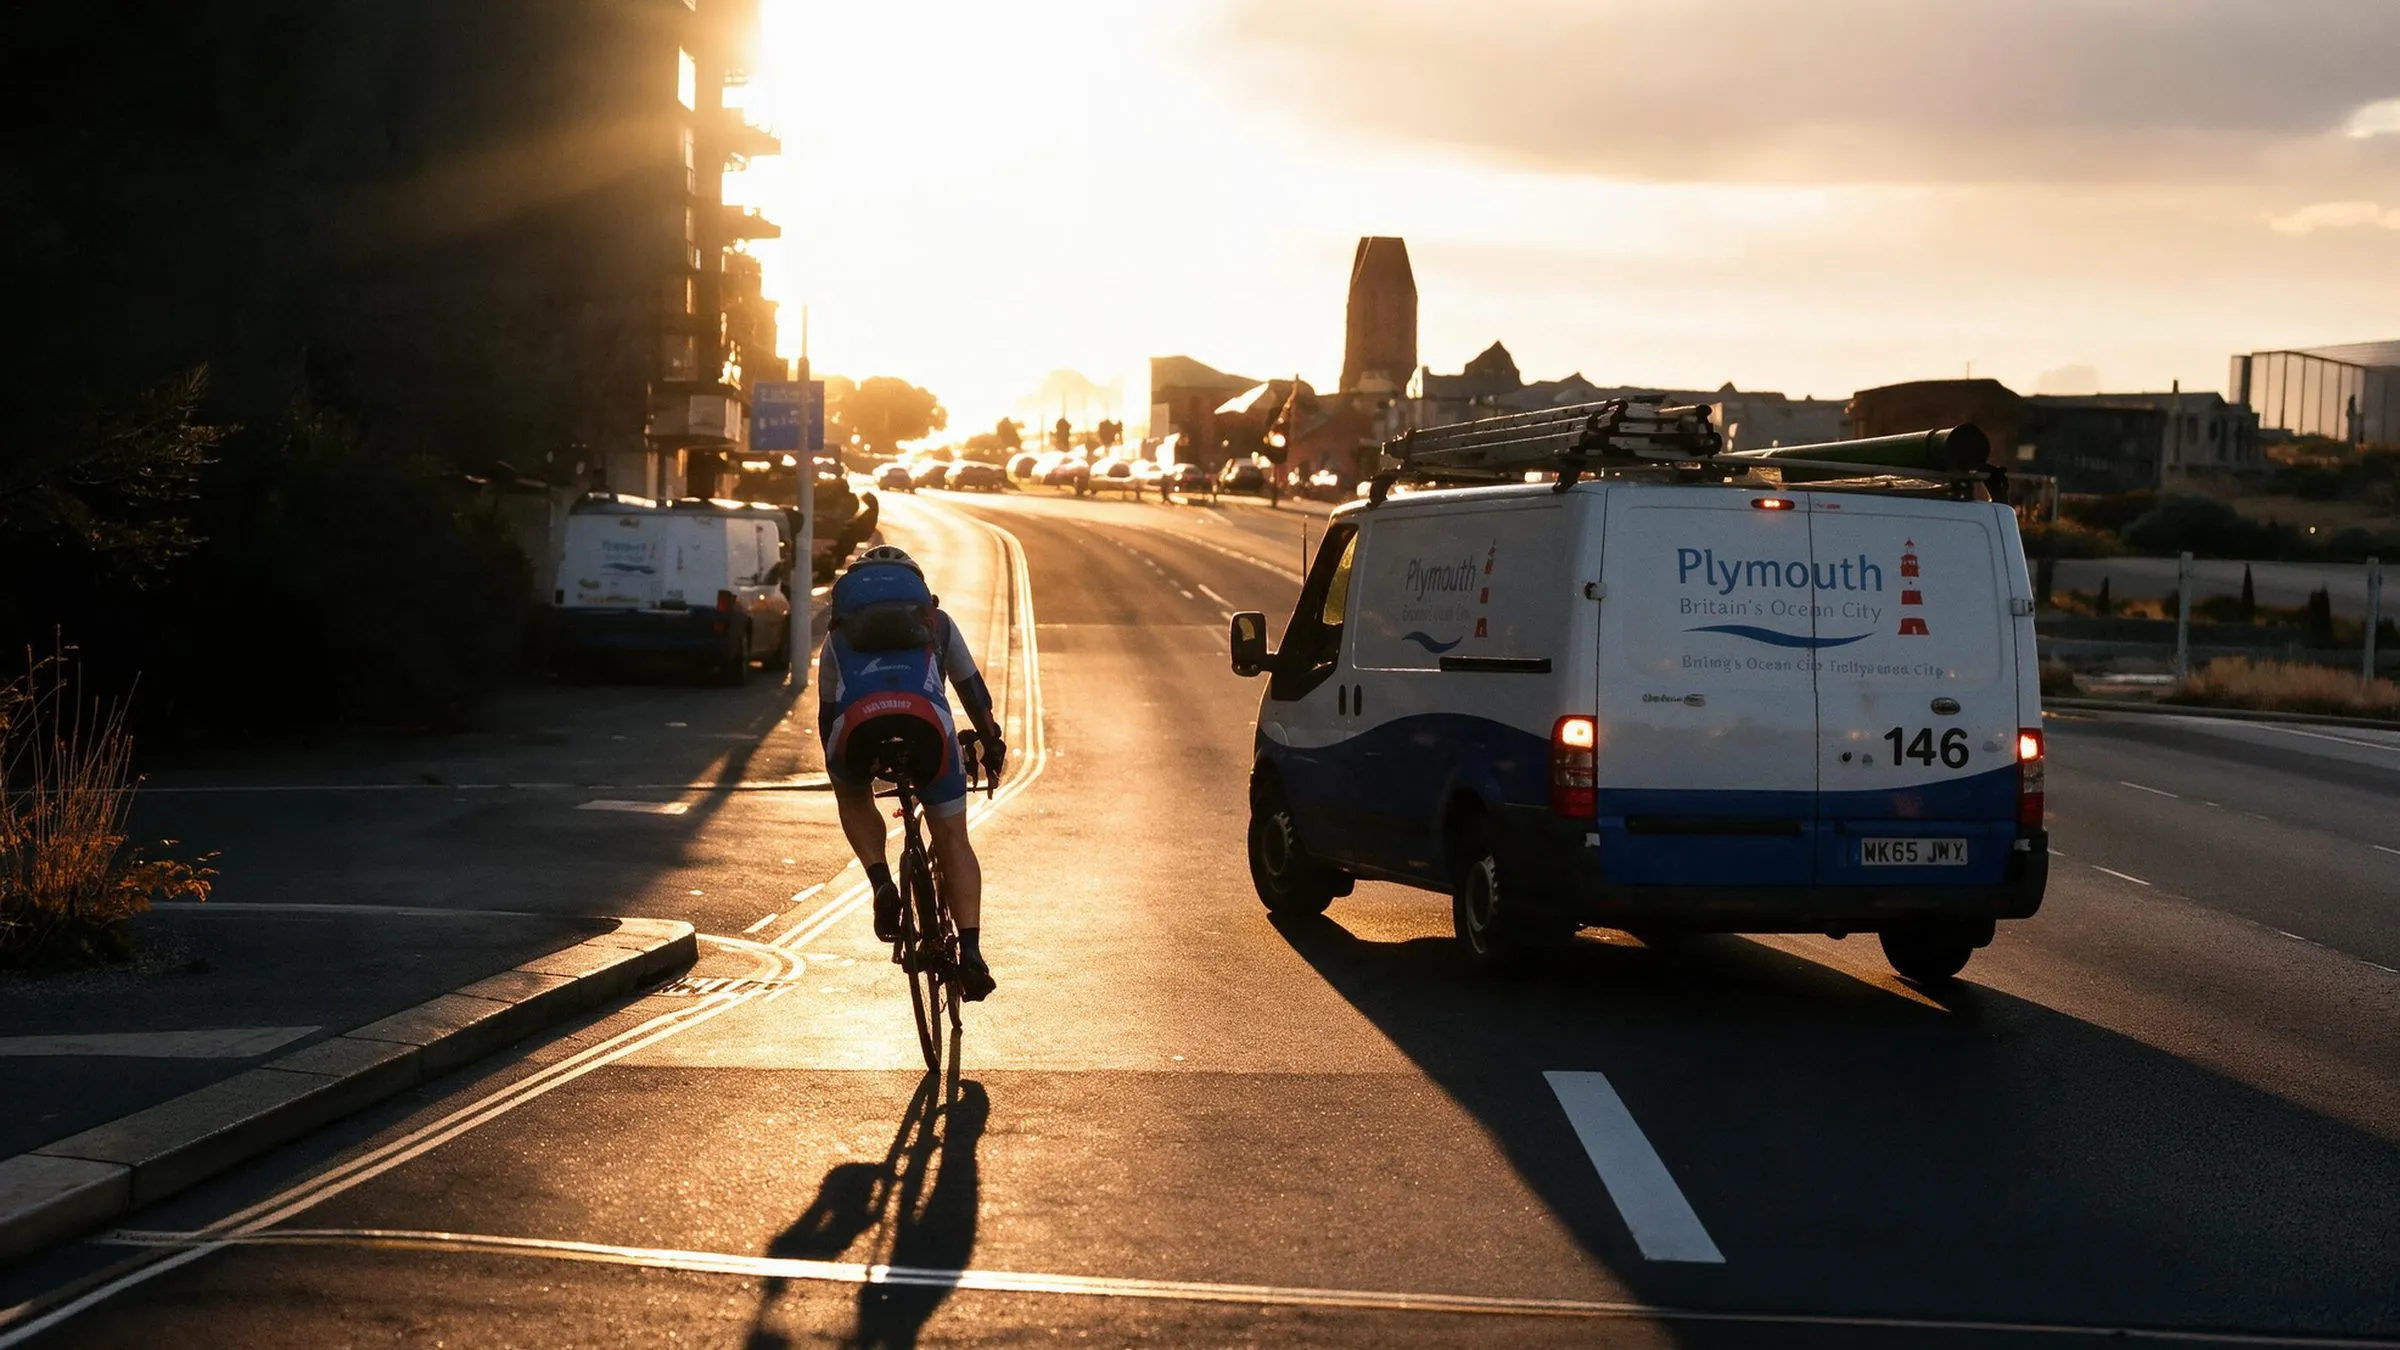
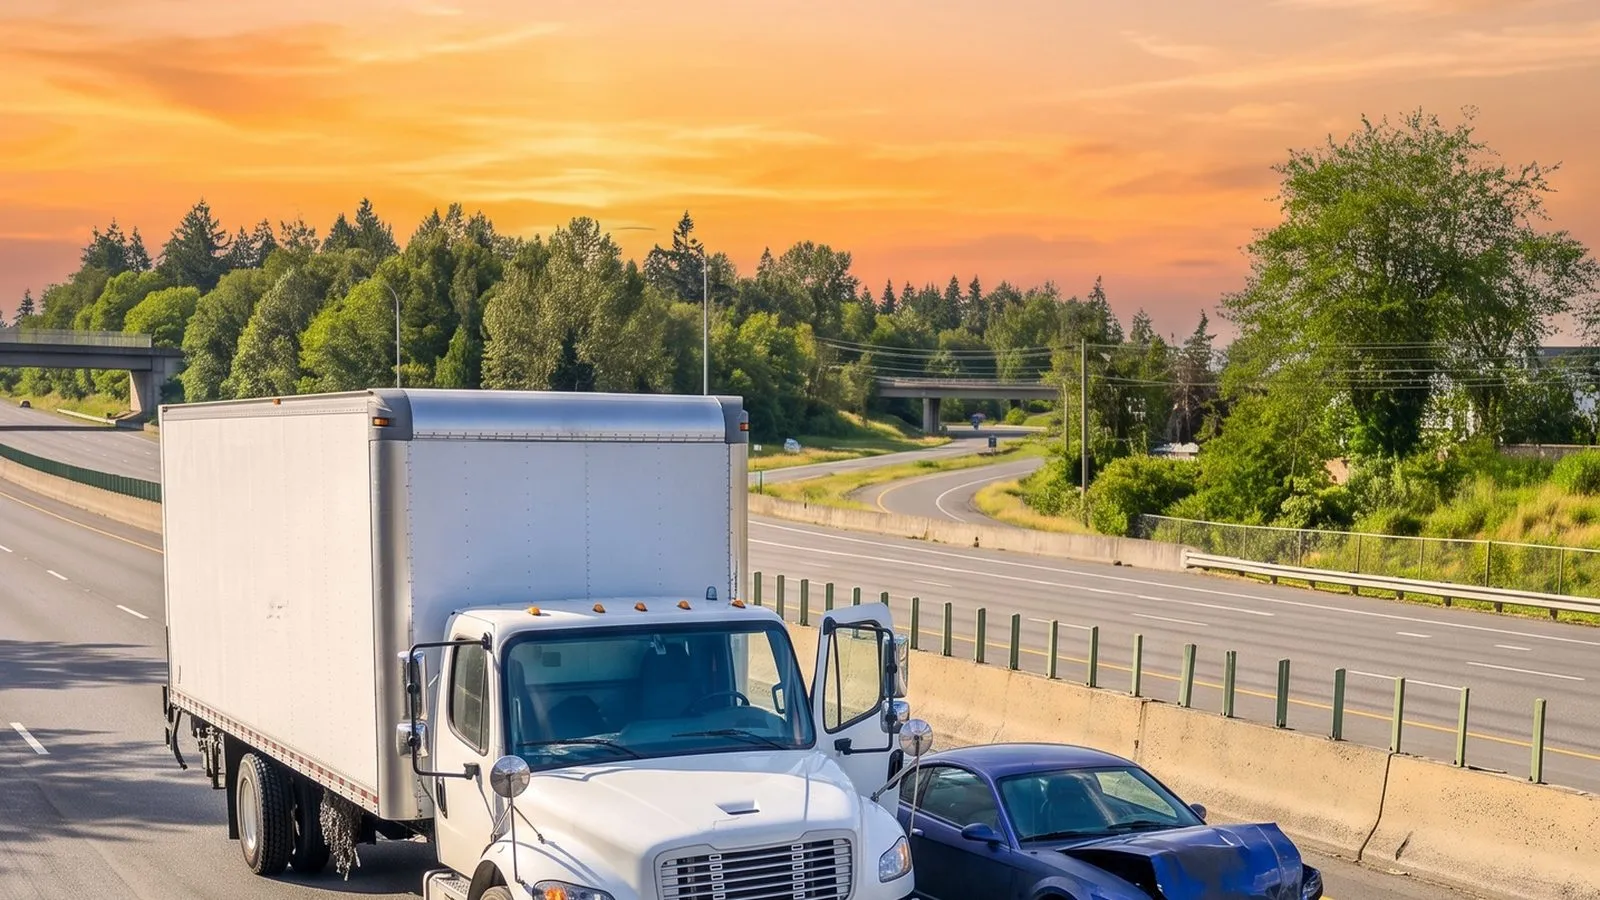
When two vehicles collide, somebody is required to write it down. A police report, usually an insurance claim, sometimes a line in a federal database. Almost everything the world knows about road risk comes from those records.
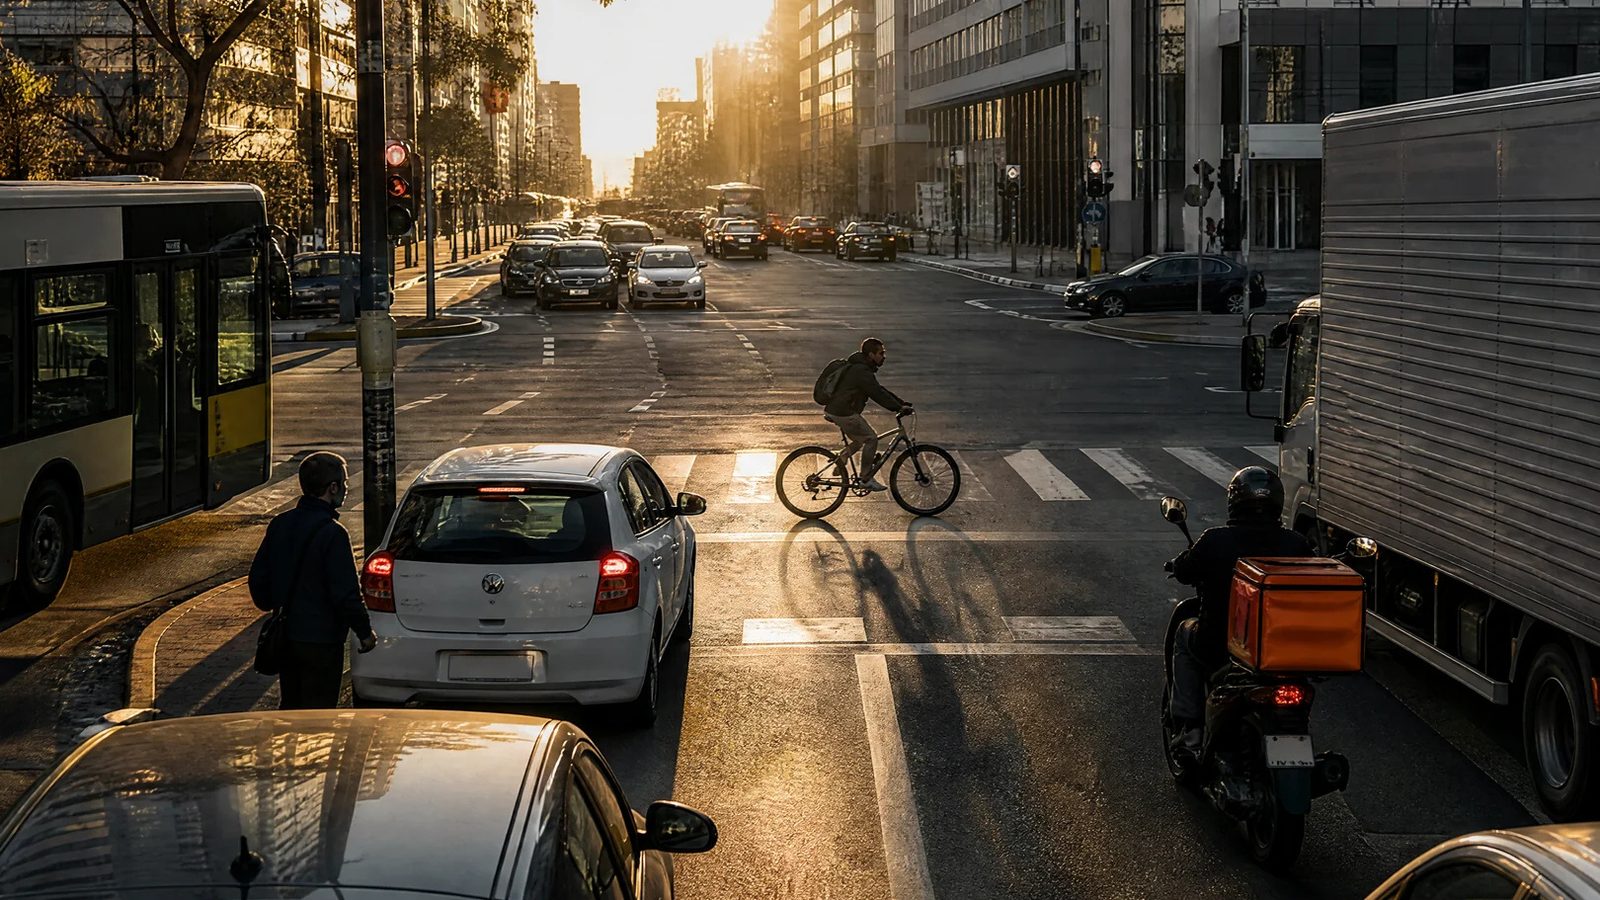
Everything that almost happened produces nothing at all. A driver brakes hard at the bottom of a ramp and the moment passes. Someone steps off a curb into a gap that closes faster than they expected, and the only two people who will ever know are the two involved.
Those events are most of what a road actually does on a given day. Research studies have counted them before, on small samples of instrumented cars over short windows. What has never existed is a continuous count at national scale, on roads nobody set up for the purpose.
We counted them.
Nexar and Nauto have each been observing roads for eleven years. The record now holds more than 10 billion miles, with more than 300 million added every month. This count takes one complete year out of it, from a single sensor population, so the month-to-month comparisons mean something.
Between September 2025 and August 2026, across 1.1 billion miles observed by the Nexar connected-sensor fleet, the record holds almost nineteen events that crossed our near-miss threshold for every one that became a collision. 1,815,827 near misses. 95,805 collisions.
Put another way, the collision is one event in twenty. It is also the only one anybody has ever been required to keep. Every risk model in transportation, insurance and public infrastructure is built on that single event. It was the only one available.
What the numbers describe.
This record describes conditions on a road rather than individuals.
A hard brake is a deceleration event the sensor registers on its own accelerometer, at the device's standard detection threshold. Not every hard brake is a near miss, and not every near miss produces one. It is a proxy, and it is the one this fleet detects reliably.
The fleet is about 87% professional drivers, weighted toward dense urban markets. Three states account for 51.5% of the near misses in this window: New York, California and Texas. So the ratio above describes those drivers on those roads. Anyone extending it to the average American driver is going further than the data does.
The ratio also varies sharply by vehicle type, from 4.8 to one for trucks up to 35 to one for consumer drivers, with taxi and rideshare at 23.8. The blended figure above is mostly the third of those. We are not putting those numbers side by side as a safety comparison, because braking physics and collision severity differ enough between a loaded truck and a sedan that a shared threshold does not compare them fairly. We are publishing the range so that nobody has to take the blended number on faith.
Season stands in for weather, because we did not have meteorological data for this window. That counts a mild January in Georgia the same way as a hard one in Minnesota. The seasonal finding holds, and it is coarser than we would like.
Source: Nexar connected-sensor fleet. 74.3 million rides, 56.7 million hours, 1.105 billion miles, United States, September 1 2025 through August 31 2026.
What only the near misses show.
Nineteen to one, every month.
18.95 to one across the full year. Per million miles driven, the fleet recorded 1,643 near misses and 86.7 collisions.
Month by month the ratio moves between 16.3 and 24.1 and never breaks pattern. That steadiness is the finding. A number that swung wildly would tell us we were measuring our own detection threshold rather than the road. This one behaves like a property of driving.
The buffer thins exactly when the road gets worse.
Fall and winter produce about 35% more collisions per mile than summer. No surprise there.
The ratio moves as well, and in the direction nobody would pick. In summer it runs at 21.1 near misses per collision. In winter it falls to 17.9, a difference of Δ 3.2.
So a hard brake on a wet road is more likely to end badly than the same hard brake in July. The warning arrives more often in bad conditions and it works less well when it arrives. Whatever margin a driver's reaction buys them shrinks at the moment they need more of it.
That is invisible in collision data. A collision count has no denominator of near misses to divide into.
The busiest hour is not the most dangerous one.
Hard braking peaks at 5 PM, with 142,489 events in that hour across the year. That is where the volume is, and it is where fleet safety programs point.
The stretch when a near miss is most likely to become a collision is late morning into midday. From 9 AM through noon the ratio sits between 14.4 and 15.4 to one, the lowest run of the day, against 22.2 at the evening peak and 27.9 after midnight. Fewer events, thinner margin.
Peak volume and peak conversion sit ten hours apart, and only one of them shows up in collision reports.
‘Why?’ is the harder question.
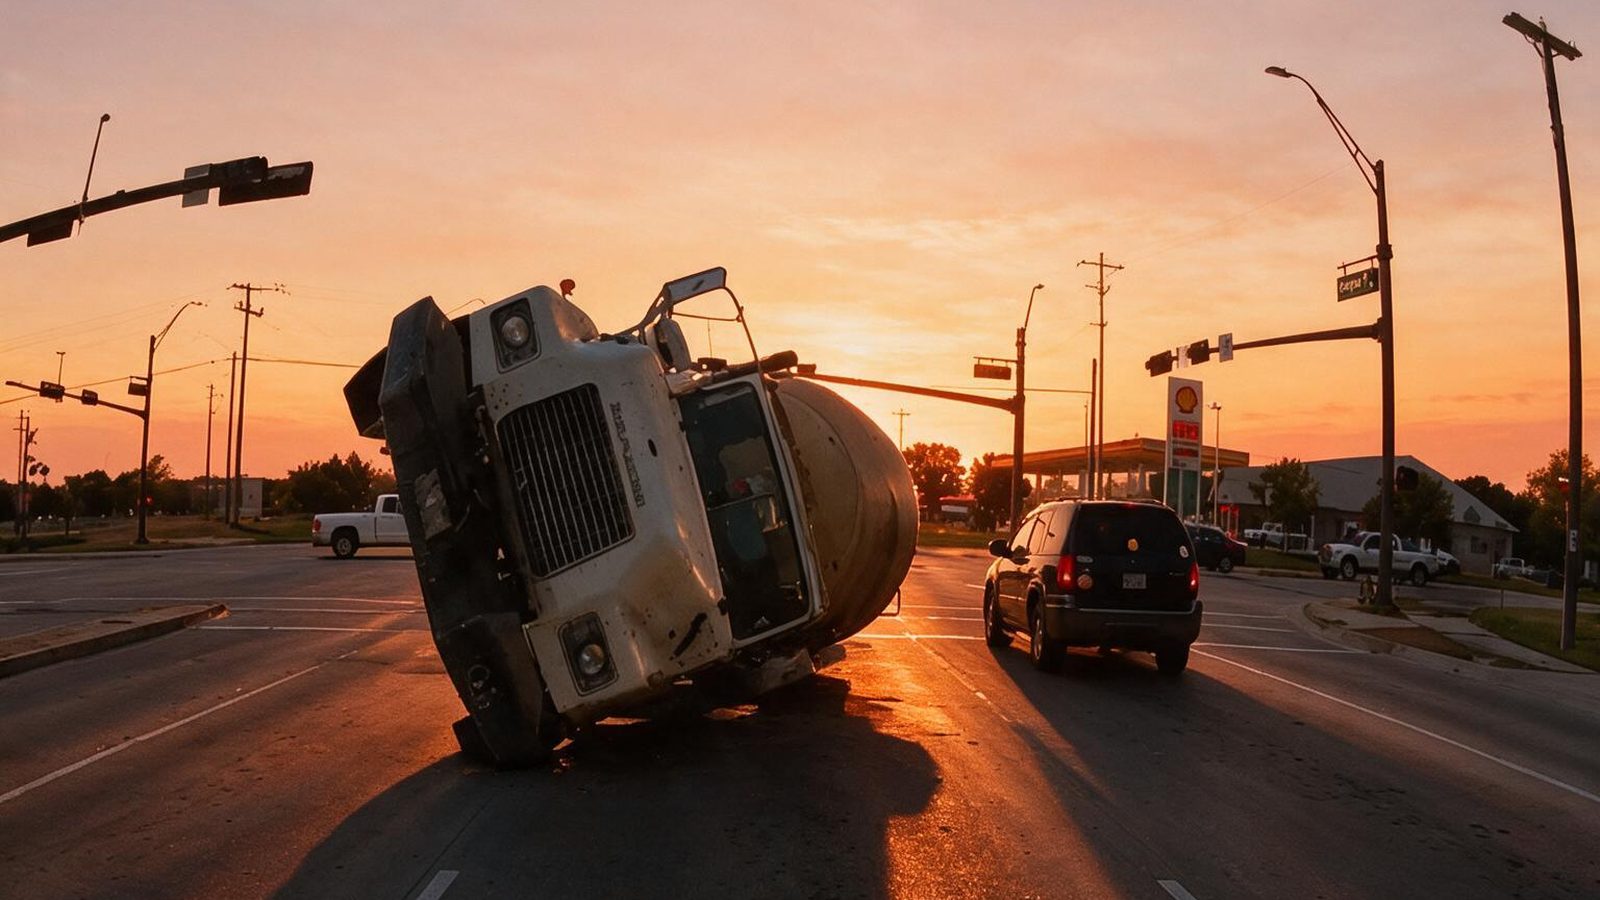
This count says how often a near miss becomes a collision. It does not say why.
For that you need two observations of the same second on one timeline: what the road presented, and what the driver did about it. That is what the combined record makes possible, and it is the one thing this cut of it cannot do alone. When we can produce it at a quality we would stand behind, we will publish it.
We compete with none of the systems we measure, which is why all of them can read from the same record.
Luc Vincent's five questions are the ones anyone buying road data should be able to answer, and he answered all five for our own record, including the two where we come off worst.
In “When AI Leaves the Screen,” Zach Greenberger describes a corner where the same near accident has happened a hundred times, and every one of those warnings disappeared. This is the first continuous count of those warnings.